
INDIAN ECONOMY
Chapter 1: Economics Introduction Chapter
Introduction
Economics is a social science that deals with the production, consumption, and distribution of goods and services, and the transfer of wealth. The term ‘Economics’ is derived from the Greek words OIKOS (“household”) and NEMEIN (“management and dispensation”). Understanding “What is Economics?” is very important for UPSC/IAS Exam 2023 to understand further concepts in a holistic manner. In this article, we will look at the meaning of economics and how it has changed over time.

What exactly is Economics?
- Economics is the study of scarcity, resource utilisation, and response to incentives, or the study of decision-making.
- Economics is a vast subject and its definition and meaning have undergone changes over a period of time.
- Aristotle, the Greek Philosopher has termed Economics as a science of ‘household management.’
- There are two branches of economics: microeconomics and macroeconomics.
Meaning of Economics
Due to its vastness, the meaning of economics has changed over the course of time. Let us see the evolution of the meaning of economics from the late eighteenth century.
Science of Wealth
- The late eighteenth-century classical thinkers viewed that economics deals with the phenomenon of wealth.
- This includes the nature and causes of wealth and the creation of wealth by individuals and nations.
Science of Welfare
- In the early nineteenth century, scholars felt that economics should address the welfare of society as only wealth divided the society into rich and poor.
- Welfare is both quantitative and qualitative. The quantitative aspects involve consumption of goods and services, increase in per capita income, etc.
Science of Scarcity and Choice
- The welfare definition only explains the material goods aspects of welfare and not the non-material services aspects.
- Since resources available in society to individuals are scarce, we try to achieve our goals by alternatively using resources and using them appropriately.
- For instance, consider an example where cloth and wheat are produced with fixed limited resources.
- When the demand for Wheat is increased either we ignore the demand and produce the same quantities of cloth and wheat or allocate more resources to wheat production by cutting from cloth production to meet the demand.
Science of Growth and Development
- In the twentieth century, the role of government to ensure the growth and development of the entire economy gained momentum.
- Therefore economics was no longer limited to individual decision-making and use of resources but included production and consumption of commodities over time.
- It is well acknowledged that in order for an individual to be able to fulfil his or her desires, the entire economy must grow and appropriate mechanisms must be found to transfer the advantages of growth among individual residents.
- As a result, the economy’s performance is critical in terms of resource utilisation, production, and distribution of products and services.
- The economy must distribute its resources across numerous alternative activities, assure their efficient utilisation, and figure out how to grow them for future economic development.
Science of Sustainable Development
- In the late twentieth century, economists talked about the welfare of future generations and the protection of the environment.
- To achieve high growth and development the natural environment is exploited.
- Increased consumption leads to wastage and it should be noted that many minerals are available in limited quantities which we may not leave behind for future generations.
- It is our moral obligation to use the limited resources available wisely and efficiently in order to secure the well-being of future generations.
- Nobel Laureate Prof. Samuelson has spelt out Economics as follows: “Economics is the study of how men and society choose, with or without the use of money, to employ scarce productive resources which could have alternative uses, to produce various commodities over time, and distribute them for consumption now and in the future among various people and groups of society”.
Chapter 2: The Law of Demand and Supply


Introduction
The law of demand and supply is an economic law that says that the price of a commodity is determined by the relationship between demand and supply. In general, as prices rise, people are willing to supply more and demand less, and vice versa when prices fall.
It indicates an individual’s level of interest in a particular good or service. Most economic principles are supported by the law of demand and supply. The topic “Law of Demand and Supply” is one of the important concepts in the UPSC/IAS 2024/25 Economy syllabus which is discussed in this article in detail.

Law of Demand & Supply – Concept
- According to the law of demand, as prices rise, buyers demand less of an economic good.
- According to the law of supply, at higher prices, sellers will supply more of an economic good.
- These two laws interact to determine the actual market prices and volume of goods traded on a market.
- Several independent factors can influence the shape of market supply and demand, influencing both the prices and quantities observed in markets.
Law of Demand
- According to the law of demand, if all other factors remain constant, the higher the price of a good, the fewer people will demand that good.
- Buyers purchase less of a good at a higher price because as the price of good rises, so does the opportunity cost of purchasing that good.
- As a result, people will naturally avoid purchasing a product that requires them to forego the consumption of something else that they value more.
- The graph below depicts the curve’s downward slope.

A, B, and C are points on the demand curve. Each point (A, B, C) represents the quantity demanded (Q) at a given price (P). For example, at point A, the quantity demanded is low (Q1) and the price is high (P1). The demand relationship curve illustrates the negative relationship between price and quantity demanded. Consumers demand less quantity of goods at higher prices, and more at lower prices.
Exceptions to Law of Demand
|
Law of Supply
- According to the law of supply, price variations for a product are linked to the quantity supplied.
- The relationship between the law of supply and demand is direct rather than inverse.
- The quantity offered increases as the price rises. Generally speaking, fewer supply results from lower prices.
- Prices that are higher encourage producers to produce more of the good or commodity, given that their costs aren’t rising as quickly.
- A cost squeeze brought on by lower pricing restricts supply. Supply slopes are as a result upwardly sloping from left to right.
- Similar to how supply restrictions affect demand, supply shocks can result in a disproportionate price change for a commodity necessary for production.
- The chart below depicts the law of supply using an upward sloping supply curve.

A, B, and C are points on the supply curve. Every point on the curve represents a direct relationship between quantity supplied (Q) and price (P). So, at point A, the quantity supplied is Q1, and the price is P1, and so on.
Determinants of Demand and Supply
Demand Determinants
While price is a primary driver of demand, several other factors influence consumer behavior:
- Income: Changes in income levels impact consumers’ ability to purchase goods.
- Tastes and Preferences: Shifts in consumer preferences can lead to changes in demand.
- Price of Related Goods: The demand for one good can be influenced by changes in the prices of related goods (substitutes or complements).
- Population and Demographics: Changes in population and demographics affect overall demand.
Supply Determinants
Supply, too, is influenced by various factors beyond price:
- Production Costs: Changes in input costs like labor, raw materials, and technology impact production decisions.
- Technology and Innovation: Advances in technology can lead to increased production efficiency.
- Number of Producers: An increase in the number of producers can influence total supply.
- Government Policies: Regulations and taxes can impact the cost of production and, consequently, supply.
Factors Affecting Supply and Demand
Factors Affecting Supply
- When product prices are below manufacturing costs in businesses where suppliers are unwilling to lose money, supply tends to decline until it reaches zero.
- Price elasticity will also be influenced by the quantity of sellers, their combined production capability, how readily it can be raised or dropped, and the competitive dynamics of the market.
- Taxes and rules may also be important.
Factors Affecting Demand
- One of the key factors affecting demand is consumer income, preferences, and readiness to switch from one product to another.
- Since the marginal utility of goods decreases as the quantity owned rises, consumer choices will depend in part on a product’s market penetration.
Demand Elasticity
Demand elasticity or price elasticity of demand refers to the degree to which rising prices translate into falling demand. For example,
- The demand elasticity of corn is one if a 50% increase in corn prices causes a 50% decrease in corn demand.
- The demand elasticity is 0.2 if a 50% increase in corn prices only reduces the quantity demanded by 10%.
- For products with more elastic demand, the demand curve is shallower (closer to horizontal), and for products with less elastic demand, the demand curve is steeper (closer to vertical).
- A new demand curve must be drawn if a factor other than price or quantity changes.
- Assume that the population of a region explodes, increasing the number of mouths to feed. In this scenario, even if the price remains constant, more corn will be demanded, causing the curve in the graph below to shift to the right (D2).
- Other factors, such as changes in consumer preferences, can also cause the demand curve to shift.
- If cultural shifts cause the market to prefer quinoa over corn, the demand curve will shift to the left (D3).
- If consumer income falls, reducing their ability to purchase corn, demand will shift to the left (D3).
- If the price of a substitute increases from the consumer’s point of view, consumers will buy corn instead, and demand will shift right (D2).
- If the price of a supplement, such as charcoal for grilling corn, rises, demand will shift to the left (D3).
- If the future price of corn is higher than the current price, demand will temporarily shift to the right (D2), because consumers will be more inclined to buy now before the price rises.

Equilibrium
- The equilibrium price, also known as a market-clearing price, is the price at which the producer can sell all of the units he wants to produce and the buyer can buy all of the units he wants to buy.

- It is easy to see how an upward-sloping supply curve and a downward-sloping demand curve will intersect at some point.
- At this point, the market price is sufficient to entice suppliers to bring to market the same quantity of goods that consumers are willing to pay for at that price.
- Supply and demand are in equilibrium.
- The precise price and amount at which this occurs are determined by the shape and position of the respective supply and demand curves, both of which are influenced by a variety of factors.
Examples of Law of Supply
- When college students realize that computer engineering jobs pay more than English professor jobs, the supply of computer engineering majors will increase.
- When consumers begin to pay more for cupcakes than for donuts, bakeries will increase their cupcake output while decreasing their donut output in order to increase their profits.
- When your employer pays time and a half for overtime, you increase the number of hours you are willing to work.
Significance
Law of Demand and Supply – Significance
- The Law of Demand and Supply is critical because it assists investors, entrepreneurs, and economists in understanding and forecasting market conditions.
- For example, a company launching a new product may purposefully attempt to raise the price of the product by increasing consumer demand through advertising.
- At the same time, they may try to raise their prices even further by deliberately limiting the number of units they sell in order to reduce supply.
- In this scenario, supply would be reduced while demand would be increased, resulting in a higher price.
- Together with the Law of Supply, the Law of Demand helps us understand why things are priced the way they are and to identify opportunities to buy perceived under-priced (or sell perceived overpriced) products, assets, or securities.
- For example, a company may increase output in response to rising prices caused by a surge in demand.
Law of Demand and Supply – Applications
Price Determination and Market Equilibrium
- The interaction between demand and supply determines the equilibrium price and quantity in a market.
- Equilibrium is reached when the quantity demanded equals the quantity supplied, ensuring that no excess demand or supply exists.
Policy Formulation and Predictive Insights
- The law of demand and supply aids policymakers in understanding the impact of various policies on markets.
- It also allows for predictions about the effects of changes in demand and supply on prices and quantities.
Real-World Scenarios
- From basic commodities to luxury goods, the law of demand and supply manifests in various real-world scenarios.
- Its application is visible in determining everything from the price of oil to the availability of electronics.
Law of Demand and Supply – Drawbacks
- Unemployment is caused by a lack of demand for goods.
- During the Great Depression, factories sat idle and workers were laid off because there was insufficient demand for those products.
- In the case of Giffen goods, when the price of a Giffen good rises, demand rises, and demand falls when the price falls. For example, staple food, similar to bread or rice, for which there is no viable substitute. The demand for these goods is increasing, which contradicts demand laws.
- Prestigious Goods: Demand for goods of prestige like gold may not decrease even if there is a rise in price. They are purchased and consumed because of their high prices.
- Hobbies: The law of demand is not applicable in the case of goods of hobbies like ticket collection, and collection of historical and archaeological materials. The things are collected even by paying more and more price.
- Addiction: In the case of goods and addiction like alcohol, tobacco, drugs, etc the demand does not decrease even if there is an increase in price. Instead of the operation of the law of demand, consumers purchase more units even if there is a rise in price.
- Future Prices: When the price of rice rises and the seller expects the price to rise further in the future, supply will decrease because the seller will be induced to withhold supplies in order to sell later and earn larger profits.
- Agricultural Output: The law of supply may not apply in the case of agricultural commodities because production cannot be increased all at once in the event of a price increase.
- Subsistence Farmers: The law of supply may not apply in underdeveloped countries where agriculture is dominated by subsistence farmers.
- Factors Other Than Price Are Not Constant: The law of supply is stated with the assumption that factors other than the commodity’s price remain constant.
Conclusion
The law of supply and demand thus combines two major economic theories that explain how variations in the price of a resource, good, or service affect its supply and demand. In practice, the market equilibrium price is determined by people’s willingness to supply and demand a good, or the price at which the quantity of the good that people are willing to supply equals the quantity that people demand.
Mains Questions
Q. Define the Law of Demand and Supply. Also enumerate the drawbacks of the Law of Demand? (150 Words) 15 Marks
Chapter 3: Elasticity of Demand
Introduction
Elasticity of demand is an important variation on the concept of demand. Demand can be classified as elastic, inelastic or unitary.
An elastic demand is one in which the change in quantity demanded due to a change in price is large. An inelastic demand is one in which the change in quantity demanded due to a change in price is small.
Unitary Elasticity
If the elasticity coefficient is equal to one, demand is unitarily elastic. For example, a 10% quantity change divided by a 10% price change is one. This means that a 1% change in quantity occurs for every 1% change in price.
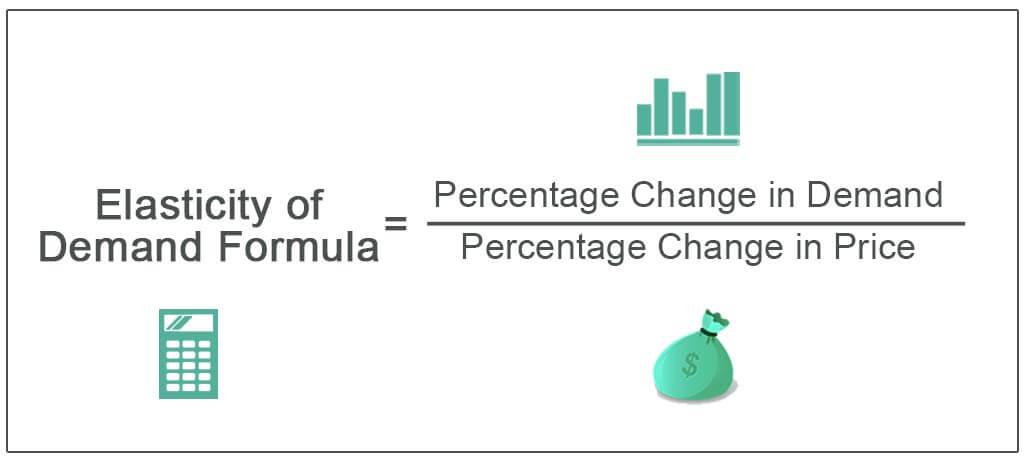
Elasticity of Demand is the percentage change in quantity demanded divided by the percentage change in one of the variables that affect demand. Price elasticity of demand measures how much a product’s consumption changes in response to price changes.
What is Elasticity of Demand?
- An elastic demand is one where there is a significant shift in the quantity demanded as a result of a price change.
- The elasticity of demand describes how sensitive a good’s demand is to changes in other economic variables like prices and consumer benefits.
- Higher demand elasticity for an economic variable indicates that the customers are more conscious of changes in this variable.
Elasticity
|

Elasticity of Demand – Example
- A product is deemed elastic if the amount wanted or purchased fluctuates more than the price does (for instance, the price increases by 5% while the demand decreases by 10%).
- Consumer durables are an example of a product with elastic demand.
- Like a washing machine or an automobile, these are products that are rarely bought and can be postponed if the price goes up.
- For instance, lowering the price of cars has been a very effective way to increase sales of cars.
Types of Elasticity of Demand
- Price elasticity of demand
- Cross elasticity of demand
- Income elasticity of demand
- Advertisement elasticity of demand
Price Elasticity of Demand (PED)
- Price Elasticity of Demand measures the responsiveness of quantity demanded to changes in price. It can be classified into three categories:
- Elastic Demand (E > 1): A relatively small price change leads to a proportionally larger change in quantity demanded.
- Unitary Elastic Demand (E = 1): A percentage change in price results in an equal percentage change in quantity demanded.
- Inelastic Demand (E < 1): Quantity demanded changes proportionally less than the price change.
- The percentage change in the quantity required divided by the percentage change in price is known as price elasticity of demand.
Measurement of Price Elasticity of Demand The price elasticity of demand can be measured in three different ways.
|
Cross Elasticity of Demand (XED)
- The responsiveness to a change in the pricing of related goods is referred to as cross elasticity of demand.
- It is defined as the ability to respond to changes in commodity X demand in response to a change in commodity Y price.
- Positive XED: Substitute goods have a positive value, indicating that an increase in the price of one leads to an increase in demand for the other.
- Negative XED: Complementary goods have a negative value, signifying that an increase in the price of one decreases demand for the other.
Income Elasticity of Demand (YED)
- The responsiveness of demand for a commodity to changes in income, with all other factors, held constant, is known as income elasticity of demand.
- Positive YED: Normal goods have a positive value, signifying that an increase in income leads to an increase in demand.
- Negative YED: Inferior goods have a negative value, indicating that an increase in income results in reduced demand.
Advertising Elasticity of Demand (AED)
- Advertising elasticity of demand (AED) is a measure of a market’s sensitivity to changes in advertising saturation.
- Advertising elasticity assesses the effectiveness of an advertising campaign in generating new sales.
- It is calculated by dividing the percentage change in demand by the percentage change in advertising spending.
- A positive advertising elasticity indicates that increasing advertising increases demand for the advertised goods or services.
Factors That Affect Price Elasticity of Demand
Availability of Substitutes
- The price will decrease more and more quickly if a customer may substitute one item for another.
- For instance, if everyone in the world prefers both coffee and tea equally, the demand for coffee will decline if coffee prices rise because people will easily switch to tea.
- This is due to the fact that tea and coffee are seen as good alternatives to one another.
Urgency
- The quantity of demand for a product will decrease in response to price rises the more discretionary the purchase is. In other words, the product demand is more elastic.
- Consider that your existing washing machine is still functional despite being old and out-of-date, but you are thinking about getting a new one.
- If the cost of a new washing machine increases, you can decide against making the purchase right away and instead hold off until the price drops or the old machine malfunctions.
- A product’s demand will decline less as its discretionary property increases. Luxury goods that people purchase because of their brand names are an example of an elastic example.
- Both addictive products and necessary add-on items, like inkjet printer cartridges, are rather inelastic.
- All of these products share the problem of having poor alternatives.
Duration of Price Change
- The duration of the price change is also important. A one-day sale has a different impact on consumer demand than a price change that lasts for a season or a full year.
- To understand the price elasticity of demand and to compare it with other items, temporal sensitivity must be clearly defined.
- Consumers could be willing to put up with a seasonal price shift rather than altering their routines.
Applications of Elasticity of Demand
- Business Strategies: Understanding elasticity helps businesses set optimal prices. For goods with elastic demand, price cuts may lead to higher revenue, while for inelastic goods, higher prices might generate more revenue.
- Taxation and Revenue: Governments consider elasticity when levying taxes. For inelastic goods, higher taxes may lead to increased revenue, while for elastic goods, taxes could lead to reduced consumption and revenue.
- Consumer Behavior Analysis: Elasticity provides insights into how consumers react to price changes, aiding companies in making informed decisions about product launches, pricing adjustments, and marketing strategies.
Conclusion
Understanding Elasticity of Demand provides a lens through which consumer behavior and market dynamics can be interpreted. A change in a commodity’s price has an impact on its demand.
By comparing the percentage price changes with the quantities demanded, we may determine the elasticity of demand or the degree of responsiveness of demand.
Mains Questions
Q. Discuss the importance of measuring the Elasticity of Demand in an Economy? (150 Words) 10 Marks
Chapter 4: Sectors of the Economy
Introduction
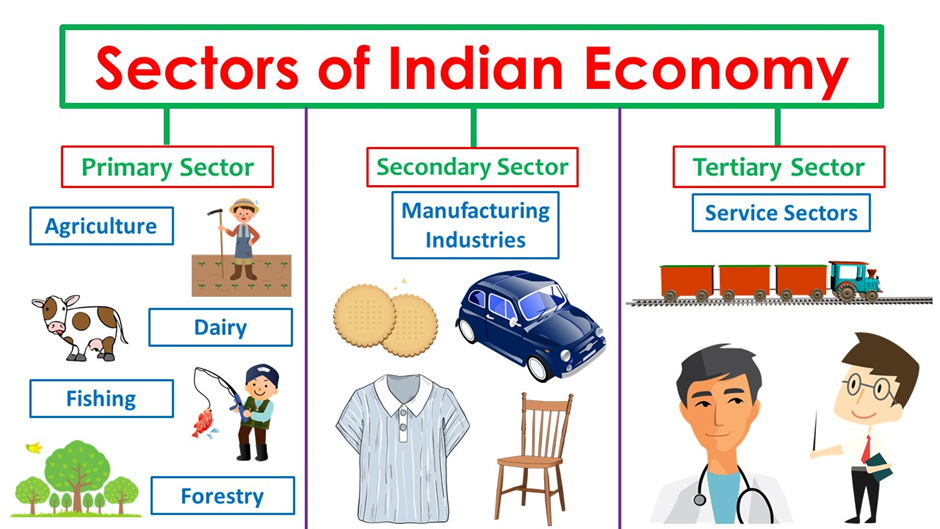
There are three main sectors of the Indian economy: primary sector, secondary sector, and tertiary sector i.e., agriculture, manufacturing, and service sectors.
According to the most recent ‘World Economic League Table 2020’ report, India has surpassed both France and the United Kingdom to become the world’s fifth-largest economy in 2019.
India is expected to be the world’s second-largest economy by 2050. The topic “Sectors of Indian Economy” is one of the important topics in the UPSC/IAS 2023 Economy syllabus which is discussed in this article in detail.
Primary, Secondary, and Tertiary Sectors
What are Sectors in the Economy?
- The Indian economy operates within a diverse framework of sectors, each playing a crucial role in its growth and development.
- These sectors, each with its unique characteristics and contributions, form the backbone of India’s economic landscape.
- On the basis of ownership, labour conditions, and the nature of the operations, the Indian economy can be divided into numerous sectors.
- But the three main sectors of the Indian Economy are: the primary sector, the secondary sector, and the tertiary sector are discussed below.
- During the early stages of civilization, the primary sector accounted for all economic activity.
- People’s demand for other items grew as a result of the surplus food production, resulting in the growth of the secondary sector.
- During the nineteenth century’s industrial revolution, the secondary sector expanded its significance.
- To facilitate industrial activities, a support system was required. Certain industries, such as transportation and finance, were critical in sustaining industrial activity.
Main Sectors in India’s Economy
On the Basis of Activity Nature, the three main sectors of the Indian Economy are the primary sector, the secondary sector, and the tertiary sector.
Primary Sector
- The activities of the primary sector of the economy are carried out by utilising natural resources directly.
- Agriculture, mining, fishing, forestry, dairy, and other industries fall into this category.
- It is thus named because it serves as the foundation for all other sectors.
- About 54.6 percent of the total workforce in the country is still engaged in agricultural and allied sector activities.
- Agriculture, together with fisheries and forestry collectively make up one-third of India’s GDP. The primary sector generates 18.20 percent of the GDP.
- India’s economy has always been based primarily on agriculture. In addition, India is the second-largest producer of groundnuts, wheat, sugar, freshwater fish, and milk in the world.
- It is also known as the Agriculture and Allied Sector since agriculture, dairy, forestry, and fishing provide the majority of the natural items we consume.
- Due to the nature of their profession, people who engage in primary activities are referred to as red-collar employees.
- Underemployment and covert employment are the two main problems this industry is dealing with.
Secondary Sector
- The secondary Sector covers industries that manufacture finished goods from natural materials harvested in the primary sector.
- This sector includes operations such as industrial production, cotton fabric manufacture, sugar cane production, and so on.
- As a result, rather than producing raw materials, it is the sector of a country’s economy that manufactures goods.
- This sector is often known as the industrial sector because it is involved with various types of industries.
- Blue-collar employees are those who engage in secondary activities.
- The contribution of the industrial sector has been constantly declining since 2011-12.
Tertiary Sector/Service Sector
- The Tertiary Sector covers the services provided in the economy and not the goods or tangible items.
- The services sector’s significance in the Indian economy has been steady, with the sector now accounting for over 54 percent of the economy and almost four-fifths of total FDI inflows.
- The activities of this sector contribute to the growth of the primary and secondary sectors.
- Economic activities in the tertiary sector do not produce things on their own, but they do help or assist production.
- The sector includes goods transported by trucks or trains, as well as banking, insurance, and finance.
- It adds value to a product in the same way that the secondary sector does.
- These sector jobs are called white-collar jobs.
Quaternary Sector
Quinary Sector
|
Why did India shift from the primary sector to the services sector and not the secondary sector?
- A country’s normal economic path is from agrarian to industrial to a service economy, but India has jumped ahead of the curve from agrarian to service economy.
- Diversification towards services has been a notable element of India’s recent prosperity, with the services sector accounting for the majority of GDP.
- India has become a prominent services exporter thanks to its success in software and IT-enabled services (ITeS), with its share of global services exports rising from 0.6 percent in 1990 to 3.3 percent in 2013.
- Other factors for the country’s quick expansion in the service industry include well-educated and vast human resources, fluency in English, and the availability of cheap labour.
- On the other hand, low growth in the Secondary sector can be attributed to:
- The license Raj
- Restrictions on foreign investment
- Lack of measures to promote private industry
- Power Deficit
- Stringent Labour laws
- Lack of skilled labour
- Delays in Land Acquisition and environmental Clearances
- Import of cheap manufactured goods etc.
- Despite its low per capita income, India’s percentage of GDP from services is approaching the worldwide norm. However, unlike the global average, the contribution of services to employment was much lower.
- Because the manufacturing sector is labour-intensive, greater emphasis on manufacturing through initiatives such as ‘Make in India’ would help to remedy this anomaly and increase employment in line with GDP growth.

Other Sectors in India’s Economy
1) On the Basis of Work Condition
Organised Sector
- In this industry, employment terms are set and consistent, and employees are guaranteed work and social security.
- It can also be characterised as a sector that is registered with the government and is subject to a variety of laws. The organised sector includes schools and hospitals.
- Workers in the organised sector have more job security.
- They are only required to work a set amount of hours. If they work longer hours, the company must compensate them with overtime pay.
Unorganised Sector
- A home-based worker, a self-employed worker, or a wage worker in the unorganised sector is considered an unorganised worker, as is a worker in the organised sector who is not covered by any of the welfare schemes listed in Schedule II of the Unorganized Workers Social Security Act, 2008.
- Due to the transient and seasonal nature of employment and the dispersed placement of businesses, wage-paid labour in this sector is typically non-unionized.
- Low wages, insecure and irregular employment, and a lack of protection from legislation or trade unions characterise this industry.
- The unorganised industry relies primarily on labour-intensive and locally developed technology.
- Workers in the unorganised sector are so dispersed that the legislation’s execution is woefully inadequate and ineffectual. In this industry, there are few unions to function as watchdogs.
- However, as compared to the organised sector, the unorganised sector makes a significant contribution to national income.
- It contributes more than 60% of national income, whereas the organised sector contributes about half of that, depending on the industry.
2) On the Basis of Asset Ownership
Public Sector
- The government owns the majority of the assets in the sector, and it is the segment of the economy responsible for providing various governmental services.
- The public sector does not exist solely to make money.
- Governments raise funds through taxes and other means to cover the costs of the services they provide.
Private Sector
- Asset ownership and service delivery are in the hands of private individuals or organisations in the private sector.
- It is also known as the citizen sector, and it is administered by private persons or groups, usually for profit, and is not governed but regulated by the government.
- The private sector’s activities are guided by the desire to make money. We must pay money to these people and companies in order to obtain such services.
Conclusion
The sectors of the Indian economy, interwoven like threads in a tapestry, collectively contribute to the nation’s progress. The primary sector anchors livelihoods, the secondary sector builds infrastructure, and the tertiary sector catalyzes innovation and services. India’s efforts and initiatives reflect its commitment to balanced growth across sectors, aiming to create a robust and self-reliant economy that benefits all its citizens.
Mains Questions
Q. Discuss as to why the Indian Economy shifted from Primary Sector to Tertiary Sector directly galloping the secondary sector? (150 Words) 10 Marks
Q. Describe the contribution of Primary Sector in the growth trajectory of any country? (150 Words) 10 Marks
Chapter 5: The Economic Systems: Capitalistic, Socialistic and Mixed Economies


Introduction
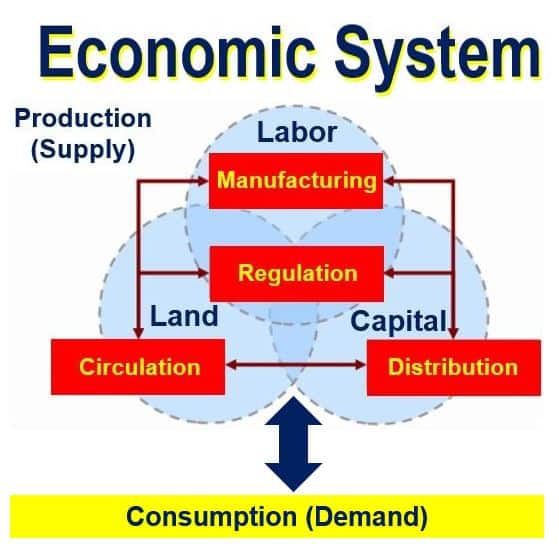
An economic system is a tool that the government uses to plan and distribute accessible services, resources, and commodities across the country. The factors of production, such as land, capital, labour, and physical resources, are regulated by economic systems. A community’s economic system is made up of a variety of institutions, organisations, entities, decision-making mechanisms, and consumption patterns. The topic “Economic System” is one of the important concepts in the UPSC/IAS 2023 Economy syllabus which is discussed in this article in detail.
What exactly is an Economic System?
- An economic system serves as the foundation upon which a nation’s economic activities are structured and organized.
- An economic system or economic order, is a method used by organizations or governments to coordinate and distribute resources, services, and goods throughout a territory or nation.
- It delineates how resources are allocated, goods and services are produced, distributed, and consumed, and the overall economic landscape functions.
- Economic systems combine wealth, labour, physical resources, and business personnel to handle production factors.
Types of Economic Systems
-
Capitalist Economy
- In a capitalist society, items are distributed among individuals based on purchasing power, which is the ability to buy goods and services, rather than on what they want.
- This implies that a person must have sufficient funds to purchase products and services.
- For example, low-cost housing for the poor is desperately needed, yet there will be little demand in the market because the poor lack the purchasing ability to support it.
- As a result, the goods will not be produced and distributed according to market forces.
-
Socialist Economy
- In a socialist economy, the government decides what products should be made to meet society’s needs.
- It is assumed that the government is aware of what is appropriate for the country’s population. As a result, individual purchasers’ passions aren’t given much consideration.
- The government makes decisions about how items are made and how they are disposed of.
- In theory, sharing under socialism is based on what each individual requires rather than what they can afford.
- Because everything is controlled by the government in a socialist regime, there is no separate estate.
-
Mixed Economy
- The characteristics of both the socialist and capitalist economic systems can be found in mixed systems.
- Mixed economic systems are also called dual economic systems for this reason.
- A genuine approach to determining a mixed system, on the other hand, does not exist.
- In some parts of the economy, this term refers to a market system that is subject to rigorous administrative regulation.
Characteristics of an Economic System
All economic systems must address the following four fundamental economic problems:
What goods should be produced?
- Pricing theory serves as the foundation for this important economic issue.
- In this context, the theory of pricing deals with the economic trade-offs between producing capital goods and consumer goods in the face of resource scarcity.
- In this regard, it is crucial to critically assess the demands of society in light of population demographics such as age, sex, occupation, and geography.
How should the goods be produced?
- The main problem of how things should be produced is heavily dependent on the least-expensive method of production that should be used as profitably unique to the economically determined commodities and services to be produced.
- Broadly speaking, labor-intensive and resource-intensive techniques of production are the options.
How should be the produced goods distributed?
- When the final consumers receive the goods, production is said to be finished.
- In order to minimize bottlenecks and clogs in the chain of distribution of economic resources and to maximize consumer happiness, this fundamental problem of how the output will be dispersed aims to determine the best possible medium.
When should be the goods produced?
- Given that the forces of supply and demand are highly dependent on time, seasonal analysis plays a role in consumer satisfaction.
- A thorough examination of time dynamics and seasonal fluctuation in relation to the fulfillment of consumer needs is necessary to solve this fundamental economic challenge.
- It is important to note that the type of economic system might influence the solutions to these fundamental issues.

Major Sectors of Economic System
There are three major economic sectors that make up the overall economy. They are:
- Primary Sector:The primary sector encompasses activities directly tied to the extraction of natural resources from the earth, water, and air. Agriculture, mining, forestry, and fishing stand as core activities within the primary sector, each contributing to a nation’s resource base and livelihoods.
- Secondary Sector:The secondary sector, often known as the industrial sector, plays a vital role in converting raw materials extracted from the primary sector into finished products. This sector encompasses manufacturing, construction, and energy production activities that add value to resources and contribute significantly to a nation’s economic growth.
- Tertiary Sector: Tertiary Sector, also known as the service sector is responsible for providing services to both businesses and final consumers. The tertiary sector offers a diverse array of services, from healthcare and education to finance, entertainment, and tourism.
Differences between Capitalist, Socialist, and Mixed Economies
| Parameters | Capitalist Economy | Socialist Economy | Mixed Economy |
|---|---|---|---|
| Ownership of property | Private ownership | Public ownership | Both private and public ownership |
| Price determination | Prices are determined by the market forces of demand and supply. | The central planning authority determines prices. | The central planning authority, as well as demand and supply, determine prices. |
| Motive of production | Profit motive | Social welfare | In the private sector, profit is the motivating factor, while in the public sector, welfare is the motivating factor. |
| Role of government | No role | Complete role | Full role in the public sector and limited role in the private sector |
| Competition | Exists | No competition | Exists only in the private sector |
| Distribution of income | Very unequal | Quite equal | Considerable inequalities exist |
Conclusion
Economic systems shape the destiny of nations, influencing resource allocation, production, distribution, and ultimately, the quality of life for citizens. India’s mixed economy approach, coupled with strategic efforts, aims to achieve balanced growth and inclusivity.
As nations navigate the complexities of economic systems, the goal remains to foster prosperity while safeguarding the well-being of current and future generations.
Mains Questions
Q. Give an overview of the various types of Economic System? (150 Words) 10 Marks
Chapter 6: National Income Accounting: It's Objectives and Significance
Introduction
National Income Accounting is a systematic framework used to measure and analyze the economic activity of a country over a specific period. National Income Accounting includes total revenues made by domestic firms, wages given to foreign and domestic workers, and the amount spent on sales and income taxes by corporations and individuals resident in the nation.
The topic “National Income Accounting” is one of the important concepts in the UPSC/IAS 2023 Economy syllabus which is discussed in this article in detail.
What exactly is National Income Accounting?
- National Income Accounting is a systematic framework used to measure and analyze the economic activity of a country over a specific period.
- It involves the comprehensive assessment of the total economic output and income generated within a nation’s borders.
- This framework helps in quantifying the overall economic performance, distribution of income, and various components of the economy, thereby providing valuable insights for policymakers, economists, and governments.
- National Income Accounting serves as a tool for assessing the economic health of a nation, tracking changes in economic activities over time, and guiding the formulation of economic policies.
- It encompasses various methodologies and approaches to calculate the total value of goods and services produced, income earned, and expenditures made within an economy.
- National Income Accounting is a set of methods and principles used by the government that gives information on how well an economy is performing and where money is created and spent.
- Data on per capita income and growth may be evaluated across time when paired with statistics on the corresponding population.
- The gross domestic product (GDP), gross national product (GNP), and gross national income (GNI) are some of the indicators computed using national income accounting.
- The GDP is a frequently used metric for domestic economic research that reflects the total market value of goods and services produced in a certain country during a given period of time.
- National income accounting systems enable nations to evaluate the consequences of different economic policies as well as the present level of living or income distribution within a population.
What is National Income?
|
National Income Accounting – Key Objectives
- Measuring Economic Performance: It quantifies the total economic output and income generated by an economy, providing a snapshot of its economic performance.
- Monitoring Economic Growth: By analyzing changes in the national income over time, it helps track the growth trajectory of an economy.
- Evaluating Distribution of Income: It assesses how the national income is distributed among various economic agents, such as households, businesses, and the government.
- Informing Policy Formulation: National Income Accounting data informs the formulation of economic policies, fiscal planning, and development strategies.
- Comparing Economies: It allows for international comparisons of economic performance and income distribution among different countries.
- Understanding Economic Structure: It provides insights into the composition of an economy, including the contributions of different sectors like agriculture, industry, and services.
National Income Accounting – Significance
- Although national income accounting is not an exact science, it does give important information about how well an economy is performing and where money is created and spent.
- Data on per capita income and growth may be evaluated across time when paired with statistics on the corresponding population.
- The gross domestic product (GDP), gross national product (GNP), and gross national income (GNI) are some of the indicators computed using national income accounting.
- The GDP is a frequently used metric for domestic economic research, and it reflects the total market value of goods and services produced in a certain country during a given period of time.
Accounting in India
National Income Accounting in India
The National Economic Growth Rate is determined by computing the National Income Accounting, which may be done in a variety of ways:
Income Method
- This technique is concerned with the creation of products and services using capital, land, labour, and other resources.
- Interest, profit, rent, salaries, and other sources of income are all used to create income.
- Mixed-Income, which businessmen and self-employed professionals earn, is another factor to consider.
- Therefore, National Income = Interest + Profit + Rent + Wages + Mixed Income
Example: Calculate the National Income of country X and identify which of the following is not considered while calculating National Income using the Income Method.
- Rent accrued – Rs. 10000
- Salaries – Rs. 20000
- Sale from secondhand goods – Rs. 10000
- Interest earned on Loan – Rs. 20000
Answer: National Income = Interest + Profit + Rent + Wages + Mixed Income
= 10000+20000+20000
= 50000
Here, the sale of second-hand goods will not be counted because it’s not an income generated from land and labour.
Expenditure Method
- This strategy takes into account purchases made by governments, residents, businesses, and other entities. The elements are as follows:
- C = Consumer goods and service expenditures by residents and households
- G = Government expenditures on goods and services
- I = Business Organizations’ Capital Goods and Stocks Expenses
- NX = Net exports, which is defined as exports minus imports.
- As a result, National Income = C+G+I+NX
Value Added Method/ Production Method
- While using the product method, the economy is generally classified into various industrial sectors, such as fishing, agriculture, and transportation.
- The Net Value Added at Factor Cost (NVAFC), which is the value-added at each step, is used to determine National Income.
- We must deduct the following when calculating the same for each industry:
- Net Indirect Taxes
- Capital Consumption
- Raw Material Consumption
- Now NVAFC becomes the value after the deduction of the above things.
- When the NVAFC of industries is summed, the net domestic product at factor cost (NDPFC) is calculated.
- Finally, foreign states’ net income should be included.
- Thus, in India,
- National Income = NDPFC + Net factor income from overseas
National Income Accounting – Advantages
- Economic Assessment: National Income Accounting provides a comprehensive overview of a country’s economic health, allowing policymakers and economists to assess its performance and growth.
- Policy Formulation: It aids in the formulation of effective economic policies, fiscal strategies, and development plans based on accurate data and trends.
- International Comparisons: National Income data allows for meaningful comparisons of economic performance, income distribution, and economic structures across different countries.
- Income Distribution Analysis: It helps in evaluating the distribution of income and wealth among various segments of society, enabling policymakers to address inequality and poverty.
- Resource Allocation: The data guides efficient resource allocation by highlighting sectors contributing significantly to the economy and those needing support.
- Investment Decision: Investors and businesses use national income data to make informed investment decisions by gauging the economic environment and consumer purchasing power.
National Income Accounting – Disadvantages
- Exclusion of Non-Market Activities: Non-market activities, such as household production and unpaid work, are often excluded from calculations, leading to an incomplete representation of economic activities.
- Quality of Data: The accuracy of National Income data depends on the quality of data collection, which might vary across sectors and regions.
- Excessive Focus on Quantification: Relying solely on quantitative measures might overlook qualitative aspects of economic well-being, like environmental sustainability and overall quality of life.
- Limited Scope: National Income Accounting mainly focuses on market-based activities and might not capture the informal sector, informal transactions, and underground economy adequately.
- Changing Economic Landscape: Rapid changes in technology, globalization, and emerging industries can challenge the relevance and accuracy of existing methodologies.
- Complexity of Data Interpretation: Interpreting National Income data requires a nuanced understanding of economic concepts, which might be challenging for the general public.
Conclusion
National income accounting, which is considered an aggregate of a country’s economic activity, thus provides economists and statisticians with specific information that can be used to track an economy’s health and estimate future growth and development.
The data may be used to guide inflation policy, which is especially valuable in changing economies of the developing nation, as well as information on output levels related to moving labour forces.
Mains Questions
Q. Enumerate the significance of National Income Accounting? (150 Words) 10 Marks
Chapter 7: Methods of Calculating National Income


Introduction
The different methods of calculating national income are the Income Method, Production (Value-Added) Method, and Expenditure Method. National Income serves as a critical indicator of a country’s economic health and progress.
It quantifies the total value of all goods and services produced within the country’s borders during a specific time period. To accurately measure this economic metric, economists employ various methods, each offering a unique perspective on economic activity.
The topic “Methods of Calculating National Income” is one of the important concepts in the UPSC/IAS 2023 Economy syllabus which is discussed in this article in detail.
How is National Income Calculated?
- After depreciation, the total worth of final products and services generated by normal residents throughout an accounting year is called the national income.
- Goods and services are generally produced by the production units. They do it by utilising four factors of production: land, labour, capital, and entrepreneurship.
- These four factors of production work together to create goods and services, adding value to existing goods.
- This additional value, or net domestic product, is dispersed among the owners of the four components of production, who receive rent, employee compensation, interest, and profit in exchange for their contribution to the production of products and services.
- The profits earned by the owners of the factors of production are used to acquire goods and services from the production units for consumption and investment.
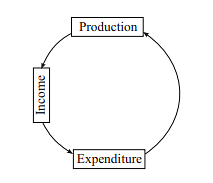
- In a nutshell, manufacturing generates revenue. Income is utilised to fund spending, and spending, in turn, fuels more production.
- The circular flow of national income has three phases: Production, Income and Expenditure.
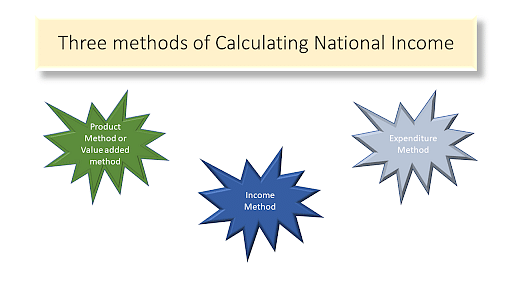
Methods of Calculating National Income
- The three methods of calculating national income are:
- Value Added Method
- Income Method
- Expenditure Method
- To enhance accuracy and comprehensiveness, economists often combine two or more methods to calculate National Income.
- This triangulation helps mitigate the limitations of individual methods and provides a more accurate depiction of an economy’s performance.
What is Value Added Method?
- Value added refers to the difference between the value of a firm’s output and the value of the intermediate goods and services used in the production process.
- It represents the net contribution of a firm or a sector to the economy.
- The method involves breaking down the economy into different sectors such as agriculture, industry, and services.
- For each sector, the value added is calculated by subtracting the value of intermediate consumption (inputs used in production) from the value of output (goods or services produced). This ensures that only the additional value created at each stage is considered.
- One of the primary challenges in calculating National Income is the risk of double counting. Double counting occurs when the value of intermediate goods and services is included multiple times in the calculation process.
- The Value Added Method addresses this challenge by excluding intermediate consumption, focusing only on the value added at each stage.
What is the Income Method?
- The Income Method is one of the key approaches used to calculate a nation’s National Income.
- It focuses on assessing the total income earned by individuals, businesses, and the government within an economy during a specific time period.
- This method provides insights into how the generated income is distributed among different factors of production, such as labor, capital, and land.
- By analyzing various sources of income, the Income Method offers a comprehensive view of the economic activity within a country.
- The method involves aggregating the different sources of income earned by various economic agents, including individuals, households, businesses, and the government.
- These sources of income include wages and salaries, rent, interest, profits, and taxes.
What is the Expenditure Method?
- The Expenditure Method focuses on estimating the total value of expenditures made by various economic agents within an economy during a specific time period, typically a year.
- By analyzing the expenditures made by consumers, businesses, government entities, and net exports (exports minus imports), the Expenditure Method provides insights into the overall economic activity and performance of a country.
- The Expenditure Method is based on the principle that the total expenditure in an economy is equal to the total income generated in that economy.
- It assumes that every transaction that involves spending contributes to the production of goods and services, and thus, to the generation of income.
- To avoid double counting, certain items such as intermediate goods (goods used in the production of other goods) are excluded, while taxes on products and subsidies are included.
Conclusion
Calculating National Income is a complex endeavor that requires a comprehensive approach. By using different methods, economists and policymakers gain a multifaceted understanding of an economy’s dynamics. While each method has its limitations, their combination helps provide a more accurate and holistic picture of economic health.
Chapter 8: Economic Growth and Development
Introduction
Even though the terms economic development and economic growth sound similar, there is a significant difference between the two. While both economic growth and economic development are important indicators of a country’s economic health, there are important distinctions between the two.
Economic growth is a relatively narrow concept. It entails a quantitative increase in output, whereas economic development includes qualitative changes such as social attitudes and customs, in addition to quantitative growth in output or national income. Economic development is nearly impossible to imagine without growth.
What is Economic Growth?
- Economic growth is defined as an increase in the production of economic goods and services from one period of time to another.
- Economic growth denotes an increase in both national income and per capita income.
- The increase in per capita income is a better measure of Economic Growth because it reflects an improvement in the living standards of the masses.
- Let’s consider that a unique berry only grows naturally in the land of Utopia. This berry has been utilised by natives of Utopia for many years, but a wealthy German traveller recently found it and took samples back to Germany. Because his German acquaintances like the berry, the tourist invested in a major berry exporting company in Utopia. Hundreds of Utopians were engaged by the new berry exporting company to farm, harvest, wash, box, and ship the berries to German supermarkets.
- Because the total value of the goods and services generated by the new berry exporting business exceeded one million dollars in a calendar year, the berry exporting business added over one million dollars to Utopia’s GDP. Utopia’s GDP increased, indicating that the country achieved economic growth.
- Economic growth is defined as an increase in real national income rather than an increase in money income or nominal national income.
- In other words, the increase should be based on an increase in the output of goods and services rather than a simple increase in the market prices of existing goods.
- Real income should rise gradually over time: The rise in real national income and per capita income should be sustained over time.
- Seasonal or temporary income increases should not be confused with economic growth.
- Income growth should be based on increased productive capacity.
- Increases in income can only be sustained if they are the result of a long-term increase in the economy’s productive capacity, such as:
- modernization or the use of new technology in manufacturing, infrastructure strengthening such as transportation networks, improved electricity generation, and so on.
- Capital goods, labour force, technology, and human capital all have the potential to contribute to economic growth.
What is Economic Development?
- Economic development is defined as a sustained improvement in society’s material well-being.
- Few indicators of economic development are qualitative indicators such as the HDI (Human Development Index), gender-related indexes, Human Poverty Index (HPI), infant mortality, literacy rate and so on.
- From the above example of Utopia, before the berry exporting business, most Utopians lived in small settlements spread out over many miles. Only a small percentage of Utopians had access to schools, clean water, or healthcare. To feed their immediate families, utopian men worked long hours attempting to harvest land that was naturally unsuited for most crops.
- After the export of berries and an increase in the government’s revenue, Utopians will get better access to schools, clean water and affordable healthcare. The export industry provides better wages and fixed working hours.
- Utopia’s development indicators such as literacy rate, per capita income and access to healthcare, improve indicating economic development.
- Economic development encompasses a broader range of concepts than economic growth.
- Aside from national income growth, it includes social, cultural, political, and economic changes that contribute to material progress.
- It includes changes in resource supplies, capital formation rates, population size and composition, technology, skills, and efficiency, as well as institutional and organisational structure.
- These changes contribute to the larger goals of ensuring more equitable income distribution, increased employment, and poverty alleviation.
- It is a long chain of interconnected changes in fundamental supply factors and demand structure that leads to an increase in a country’s net national product in the long run.
Economic Growth vs Economic Development
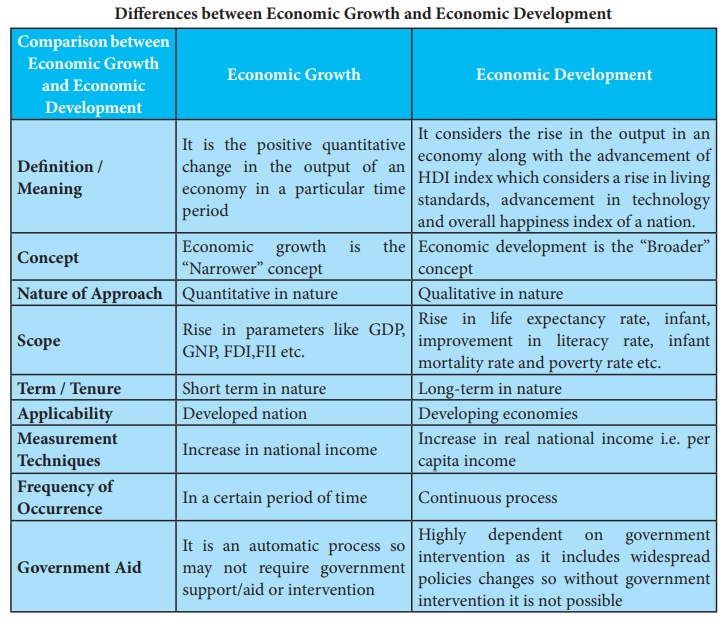
| Basis of Comparison | Economic Growth | Economic Development |
|---|---|---|
| Meaning | Economic growth is defined as an increase in the country’s real output of goods and services. | Economic development entails changes in income, savings, and investment, as well as gradual changes in the country’s socio-economic structure (institutional and technological changes). |
| Factors | Growth is defined as a gradual increase in one of the components of GDP: consumption, government spending, investment, and net exports. | Development related to human capital growth, a reduction in inequality numbers, and structural changes that improve the population’s quality of life. |
| Measurement/ Example | Economic growth is measured quantitatively by factors such as real GDP growth or per capita income growth. | To assess economic development, qualitative indicators such as the HDI (Human Development Index), gender-related indexes, Human Poverty Index (HPI), infant mortality, literacy rate, and so on are used. |
| Effect | Quantitative changes in the economy are brought about by economic growth. | Economic development results in both qualitative and quantitative changes in the economy. |
| Relevance | Economic growth reflects national or per capita income growth. | Economic development reflects progress in a country’s quality of life. |
Why Economic Growth and Economic Development are important?
- Economic growth is a widely used term in economics that is useful not only for national-level economic analyses and policymaking but also for comparative economics.
- International financial and commercial institutions base policymaking and future financial planning on the available growth rate data for the world’s economies.
- The most important aspect of growth is its quantifiability, or the ability to quantify it in absolute terms.
- Just as we need to make conscious efforts to increase our income and growth, we also need to make conscious efforts to increase our economic development and higher economic development.
- Development has not been possible anywhere in the world without a conscious public policy.
- Similarly, we can say that there can be no development without growth.
- If economic growth is used properly for development, it will re-accelerate growth and eventually bring a larger population into the development arena.
- Similarly, high growth with low development leads to a decline in growth.
Conclusion
Economic development is a subset of economic growth. Economic development encompasses a broader scope than economic growth.
Economic development employs a variety of indicators to assess the state of an economy as a whole; however, economic growth employs only a few indicators for calculation, such as gross domestic product, individual income, and so on.
It should be noted that economic growth is necessary but not the only condition for economic development.
Chapter 9: Factors Affecting Economic Growth
Introduction
Economic growth is the change – increase or decrease in the value of goods and services produced by an economy. It needs to be measured as government and private sector decisions and policies need a base for their actions. All important aspects of the economy are linked to growth: tax collections, interest rates; inflation and its expectations; employment; foreign trade and so on.
Without measuring growth, there is no rationality in behaviour – both public and private. Investment decisions depend on the growth and inflation rate, to give one example. That is the reason for the Central Statistics Office (CSO) (now National Statistical Office) of India to project growth figures weeks before the Union Budget is presented facilitating rational projection of revenues and expenditure which in turn influences the private sector decisions.

Factors Affecting the Economic Growth
Economic growth is a highly complex phenomenon that is influenced by a wide range of factors, including political, social, and cultural factors. These elements are as follows:
Economic Factors
Natural Resources
- Natural resources are the most important factor influencing an economy’s development.
- Natural resources include land area and soil quality, forest wealth, a good river system, minerals and oil resources, a favourable climate, and so on.
- The abundance of natural resources is critical for economic growth.
- A country lacking in natural resources may be unable to develop rapidly.
Capital Formation
- Capital formation is the process by which a community’s savings are channelled into investments in capital goods such as plants, equipment, and machinery, which increases a country’s productive capacity and worker efficiency, ensuring a greater flow of goods and services in a country.
Technological Progress
- Technological progress primarily entails research into the use of new and improved methods of production or the improvement of existing methods.
- Natural resources are sometimes made available as a result of technological progress. However, in general, technological progress leads to increased productivity.
Entrepreneurship
- Entrepreneurship entails the ability to identify new investment opportunities, as well as the willingness to take risks and invest in new and growing business units.
Human Resources Development
- A good quality of population is critical in determining the level of economic growth.
- As a result, investment in human capital in the form of educational, medical, and other social schemes is highly desirable.
Population Growth
- The increase in labour supply is a result of population growth, which creates a larger market for goods and services. As a result, more labour produces more output, which a larger market absorbs.
- Output, income, and employment continue to rise as a result of this process, and economic growth improves.
Social Overheads
- The provision of social overheads such as schools, colleges, technical institutions, medical colleges, hospitals, and public health facilities is another important determinant of economic growth.
- Such facilities help the working population to be healthier, more efficient, and more responsible.
Non-Economic Factors
Political Factors
- Political stability and strong administration are critical to modern economic growth.
- A stable, strong, and efficient government, honest administration, transparent policies, and their efficient implementation foster investor confidence and attract domestic and foreign capital, resulting in faster economic development.
Social and Psychological Factors
- Social factors include social attitudes, social values, and social institutions, which change as education expands and cultures shift from one society to the next.
- Modern ideology, values, and attitudes result in new discoveries and innovations, as well as the rise of new entrepreneurs.
Education
- It is now widely acknowledged that education is the primary means of development.
- Greater progress has been made in countries where education is widely available.
Desire for Material Betterment
- The desire for material advancement is a necessary prerequisite for economic development.
- Societies that place focus on self-satisfaction, self-denial, and faith in fate, limit risk and enterprise, causing the economy to stagnate.
Measures Taken to Ensure Economic Growth
- Economic growth can be achieved when the rate of increase in total output exceeds the rate of increase in a country’s population.
- A country’s human resources should be sufficient in number and equipped with the necessary skills and abilities in order to achieve economic growth.
- The efficient utilisation or exploitation of natural resources is dependent on human resource skills and abilities, the technology used, and the availability of funds. A country with a skilled and educated workforce and abundant natural resources propel its economy forward.
- Capital formation increases the availability of capital per worker, which raises the capital/labour ratio even further. As a result, labour productivity rises, leading to an increase in output and economic growth.
- Technological advancement aids in increasing productivity with limited resources. Countries that have worked in the field of technological development grow faster than countries that have placed less emphasis on technological development.
- Social and political factors play an important role in a country’s economic growth. Social factors include customs, traditions, values, and beliefs, all of which contribute significantly to an economy’s growth.
- A society with traditional beliefs and superstitions, for example, is resistant to adopting modern ways of life. Achieving becomes difficult in such a situation.
- Aside from that, political factors such as government participation in policy formulation and implementation play a significant role in economic growth.
Conclusion
Sustained economic growth in a country has a positive impact on national income and employment levels, resulting in higher living standards.
Aside from that, it plays an important role in stimulating government finances by increasing tax revenues. Economic growth in a country is possible if the economy’s strengths and weaknesses are properly assessed.
Mains Questions
Q. Discuss the factors affecting the Economic Growth? (150 Words) 10 Marks
Chapter 10: Human Capital
Introduction
The monetary value of a person’s knowledge, skills, and competencies is referred to as human capital. To determine an individual’s human capital, add up his current wages and what he is projected to earn in the future.
What is Human Capital?
- The economic value of a worker’s experience and skills is referred to as human capital. Education, training, intelligence, skills, health, and other qualities valued by employers, such as loyalty and punctuality, are all examples of human capital.
- As a result, it is an intangible asset or characteristic that does not (and cannot) appear on a company’s balance sheet.
- Human capital is thought to boost productivity and consequently profits.
- The more a firm invests in its personnel, the better its prospects of productivity and success increase.

Understanding Human Capital
- From the top down, an organisation is only as good as its people, which is why human capital is so important to a firm.
- Workforce planning and strategy, recruitment, employee training and development, and reporting and analytics are among the key directives.
- Human capital acknowledges that not all work is created equal. Employers, on the other hand, can improve the quality of that capital by investing in their workers.
- Employees’ education, experience, and abilities can be used to accomplish this. All of this has a significant economic impact on employers and the whole economy.
- These investments in human capital can be easily calculated because they are based on the investment of employee skills and knowledge through education.
- Any human capital return on investment (ROI) can be computed by dividing the company’s total profits by its entire human capital investments.
- For example, if Company Xyz invests $1 million into its human capital and has a total profit of $10 million, managers can compare the ROI of its human capital year-over-year (YOY) in order to track how profit is improving and whether it has a relationship to the human capital investments.
Human Capital and Economic Growth
- Human capital has a strong relationship with economic growth, which is why it can help boost the economy.
- This is due to the fact that people have a wide range of abilities and information. This relationship can be assessed by how much money is invested in people’s education.
- Some governments realise the link between human capital and the economy, and as a result, they provide free or low-cost higher education.
- People with a greater level of education are more likely to earn better salaries, allowing them to spend more.
Does Human Capital Depreciate?
- Human capital, like anything else, is subject to depreciation. Wages or the capacity to stay in the workforce are frequently used as indicators.
- Unemployment, injury, mental deterioration, and the inability to keep up with innovation are the most typical ways human capital depreciates.
- Consider an employee with a unique skill set. They may not be able to maintain these levels of specialisation if they are unemployed for a long time. That’s because, once they reenter the workforce, their talents may no longer be in demand.
History of Human Capital
- Human capital is a concept that dates back to the 18th century. The concept was introduced by Adam Smith in his book ‘An Inquiry into the Nature and Causes of the Wealth of Nations’, which examined a nation’s wealth, knowledge, training, abilities, and experiences.
- Adams proposed that increasing human capital through training and education results in a more profitable firm, which contributes to society’s overall prosperity. That, according to Smith, makes it a win-win situation for everyone.
- The term was most recently used to denote the labour necessary to manufacture manufactured goods.
- But the most modern theory was used by several different economists including Gary Becker and Theodore Schultz, who invented the term in the 1960s to reflect the value of human capacities
- Schultz felt that human capital, like any other type of capital, could be used to improve the quality and quantity of output. This would necessitate an investment in an organization’s employees’ education, training, and better benefits.
- But not all economists agree. Human capital, according to Harvard economist Richard Freeman, was an indicator of talent and competence.
- He believes that in order for a company to truly become productive, it must teach and inspire its personnel as well as invest in capital equipment.
- He came to the conclusion that human capital was not a component in production.
Criticism of Human Capital Theories
- Many people who work in the field of education and training have criticised the human capital idea.
- The theory was criticised in the 1960s primarily for legitimising bourgeois individualism, which was seen as greedy and exploitative.
- The bourgeoisie was made up of persons from the middle class who were seen to exploit the working class.
- The notion was also thought to hold people responsible for any systemic flaws and to turn employees become capitalists.
What Are Examples of Human Capital?
Communication skills, education, technical abilities, creativity, experience, problem-solving skills, mental health, and personal resilience are all examples of human capital.
Relationship Between Human Capital and the Economy
- Human capital enables a country’s economy to expand.
- Gains in human capital in fields like science, education, and management lead to increases in innovation, social well-being, equality, productivity, and participation rates, all of which contribute to economic growth.
- Increases in economic growth tend to increase a population’s quality of life.
What is Human Capital Risk?
- The gap between a company’s or organization’s human capital requirements and its workforce’s existing human capital is referred to as human capital risk.
- This chasm can lead to inefficiency, failure to meet goals, a tarnished reputation, fraud, financial loss, and eventual liquidation of an organization.
- An organisation should teach, foster, and support its personnel to mitigate and eliminate human capital risk.
Conclusion
- Human capital is an intangible asset that is not recorded on the financial sheet of a corporation.
- The term “human capital” refers to qualities such as an employee’s experience and skills.
- Because not all labour is created equal, firms can develop human capital by investing in their employees’ training, education, and perks.
- Economic growth, productivity, and profitability are all seen to be linked to human capital.
- Human capital, like any other asset, can depreciate due to long periods of unemployment and a failure to stay up with technology and innovation.
Chapter 11: Sustainable Development

Introduction
Sustainable development is a multidimensional concept that emphasizes achieving economic progress, social equity, and environmental protection while ensuring that the needs of the present generation are met without compromising the ability of future generations to meet their own needs. It recognizes the interdependence between economic growth, social well-being, and environmental sustainability.
When it comes to production, using recycled materials or renewable resources is an example of sustainable development.
What exactly is Sustainable Development?
- Sustainable development is an approach that aims to achieve human development objectives while allowing natural systems to support human needs for essential ecosystem services and natural resources.
- Sustainable development was first defined in the Brundtland Commission in its report Our Common Future in the year 1987.
- Sustainable development (SD) includes a concerted effort to create a future for people and the planet that is inclusive, sustainable, and resilient.
- Sustainable development aims to strike a balance between economic, social, and environmental aspects to ensure a harmonious and equitable future for all.
- It emphasizes long-term thinking, responsible resource management, and inclusive growth.
- Sustainable development is not just about economic growth; it’s a broader concept that takes into account the long-term well-being of people and the planet.
- It necessitates responsible decision-making that considers economic, social, and environmental implications.
- For instance, a project that boosts economic growth but harms the environment may not be sustainable in the long run.
- Technology and innovation play a crucial role in advancing sustainable development.
- Renewable energy technologies, efficient waste management systems, and digital platforms for education and healthcare are examples of how technology can contribute to a sustainable future.
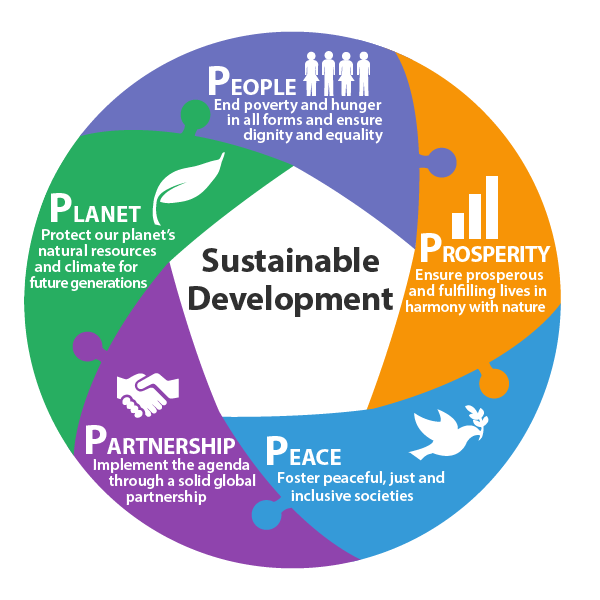
Core Elements of Sustainable Development
The three core elements of sustainable development are Economic sustainability, social sustainability, and environmental sustainability.
Environmental Sustainability
- Environmental Sustainability guarantees that nature is not treated as an unending supply of resources and that it is protected and used responsibly.
- Environmental conservation, renewable energy investment, water conservation, sustainable transportation support, and sustainable construction and design innovation all contribute to achieving environmental sustainability on multiple levels.
Social Sustainability
- Social Sustainability has the potential to promote gender equality, the development of people, communities, and cultures, as well as a fair and equitable distribution of quality of life, healthcare, and education around the world.
Economic Sustainability
- Economic Sustainability focuses on achieving equitable economic growth that provides wealth for all while minimizing environmental damage.
- Economic resources should be invested in and distributed equally.
- Poverty in all of its forms and dimensions must be eradicated.
Achieving Sustainable Development
The following principles may aid the society in attaining sustainable development:
- Limiting human activity.
- Instead of utilizing input, technological development should be input-effective.
- Consumption should not occur at a faster rate than redemption.
- The rate of consumption of renewable resources should not outpace the rate of generation of renewable alternatives.
- Pollution of all kinds ought to be minimized.
- It can be accomplished by using natural resources strategically.
Global Issues Related to Sustainable Development
- Climate Change: One of the most pressing global challenges, climate change is driven by human activities that emit greenhouse gases into the atmosphere. Rising temperatures, melting ice caps, sea level rise, and extreme weather events pose threats to ecosystems, economies, and communities worldwide.
- Biodiversity Loss: The loss of biodiversity due to habitat destruction, pollution, and overexploitation of resources has far-reaching consequences. It affects ecosystems, disrupts food chains, and reduces the resilience of ecosystems to environmental changes.
- Poverty and Inequality: Many parts of the world still grapple with extreme poverty and economic disparities. Ensuring access to basic needs like clean water, healthcare, education, and decent work for all is crucial for achieving sustainable development.
- Water Scarcity: Water scarcity is a growing concern as population growth and increased water consumption stress available water resources. This affects agriculture, sanitation, and access to clean drinking water.
- Energy Transition: The transition from fossil fuels to renewable energy sources is essential to reduce carbon emissions and combat climate change. Access to affordable and clean energy is vital for sustainable development.
- Urbanization: Rapid urbanization can strain infrastructure, lead to slum development, and result in inadequate access to basic services. Well-planned urban growth is critical for sustainable development.
- Food Security: Ensuring food security for a growing global population while minimizing the environmental impact of agriculture is a complex challenge. Sustainable agricultural practices and reducing food waste are key solutions.
- Health and Well-being: Improving healthcare, reducing disease burdens, and ensuring access to quality medical services contribute to human development and overall well-being.
- Gender Equality: Achieving gender equality is essential for sustainable development. Empowering women and girls economically, socially, and politically has a positive impact on communities and economies.
- Oceans and Marine Conservation: Overfishing, pollution, and habitat degradation threaten marine ecosystems and the livelihoods of coastal communities. Sustainable ocean management is crucial for maintaining marine biodiversity and supporting fisheries.
- Circular Economy: Transitioning from a linear economy to a circular one involves minimizing waste, promoting recycling, and designing products for durability and reusability.
- Education: Ensuring access to quality education for all is vital for human development. Education equips individuals with the skills needed for personal growth and contributing to society.
- Digital Divide: The digital divide refers to the gap in access to technology and the internet between different regions and socio-economic groups. Bridging this divide is essential for equitable development in the digital age.
Addressing these global issues requires international cooperation, policy reforms, technological innovation, and concerted efforts to promote sustainable practices at individual, community, and governmental levels.
Global Initiatives on Sustainable Development
- The Stockholm Conference,1972: It was the first step towards putting environmental issues on the international agenda. It resulted in the Stockholm Declaration, which included principles and an Action Plan with environmental policy suggestions.
- UNEP was established in 1972 to act as a catalyst for the development and coordination of an environmental focus in other organizations’ programmes.
- The Brundtland Commission’s Report was a direct result of the Earth Summit in 1992. Rio de Janeiro hosted the event. The following documents were produced as a result of the Conference:
- The Framework Convention on Climate Change (UNFCCC)
- The Convention on Biological Diversity
- The Statement on Forest Principles
- The Rio Declaration
- Agenda 21
- Rio +10, 2002: The World Summit on Sustainable Development (WSSD) in Johannesburg was a 10-year evaluation of the Rio outcomes (Rio +10).
- Ramsar Convention, 1971
- The 1972 World Heritage Convention: It is responsible for identifying and preserving the world’s cultural and natural treasures. It compiles a list of “heritage sites,” which are cultural, natural, or combined regions of “great universal importance” that must be maintained for the sake of all people.

List of Other Important Initiatives:
- Convention on International Trade in Endangered Species of Wild Fauna and Flora (CITES), 1973
- Convention on the Conservation of Migratory Species of Wild Animals (CMS), 1979
- Vienna Convention for the Protection of the Ozone Layer, 1985
- Montreal Protocol on Substances that Deplete the Ozone Layer, 1987
- Basel Convention, 1989
- Convention on Biological Diversity, 1992
- United Nations Convention to Combat Desertification, 1994
- Rotterdam Convention, 1998
- Stockholm Convention on Persistent Organic Pollutants, 2001
- Global Tiger Forum, 1993
- International Whaling Commission, 1946
- Kyoto Protocol, 1997
- Minamata Convention, 2013
- Climate change mitigation strategies: Carbon sequestration, Carbon sink, Carbon Credit, Carbon trading, Carbon offsetting, Carbon Tax, Geo-engineering
- United Nations Environment Programme (UNEP)
- UN Commission on Sustainable Development (CSD)
- United Nations Convention on the Law of the Sea (UNCLOS)
- Climate Finance Architecture: Green Climate Fund (GCF), Adaptation Fund (AF) and Global Environment Facility (GEF)
- Reducing Emissions from Deforestation and Forest Degradation (REDD) and REDD+
- Paris Agreement 2015
- The Clean Development Mechanism is a way to reduce greenhouse gas (GHGs) emissions through efficient and sound technologies
- Global Alliance for Climate-Smart Agriculture (GACSA)
- Partnership for Action on Green Economy (PAGE)
What are Sustainable Development Goals (SDGs)?
- Sustainable Development Goals (SDGs), also called development goals, are a collection of 17 objectives.
- SDGs are intended to act as a “common blueprint for peace and prosperity for people and the planet today and into the future.”
- The United Nations (UN) launched the 2030 Agenda for Sustainable Development Goals (SDGs) to mainstream sustainable development.
- Over the next 15 years, this comprehensive, integrated, and revolutionary agenda intends to encourage measures that will end poverty and establish a more sustainable world.
- By 2030, these 17 goals and 169 specific milestones must be accomplished. To achieve the goals, governments, corporations, civic society, and individuals from all walks of life must all work together.
- The Sustainable Development Goals (SDGs) are not legally binding.
Conclusion
Sustainable Development and Sustainable Development Goals are the blueprints for achieving a better, more sustainable future for everybody. To make the process of sustainable development feasible and operational, it is important to establish a common focus that can integrate the perspectives and efforts of various development participants around the world, while taking into account the diversity of geography, society, economics, science, and technology capabilities and capacities, and educational standards and levels.
Chapter 12: Monetary Policy
Introduction
Monetary policy refers to the set of actions and measures implemented by a country’s central bank to regulate and control the money supply, credit availability, and interest rates in the economy.
The primary goal of monetary policy is to achieve specific macroeconomic objectives, such as maintaining price stability, promoting economic growth, and ensuring financial stability.
Interest rate changes and adjustments to bank reserve requirements are examples of monetary policy strategies.
What exactly is Monetary Policy?
- Monetary policy is a macroeconomic plan established by the central bank.
- It is a demand-side economic strategy used by a nation’s government to achieve macroeconomic goals including inflation, consumption, growth, and liquidity.
- Monetary policy includes changing interest rates, either directly or indirectly, through open market operations, reserve requirements, or foreign exchange trading.
- Credit policy is a subset of monetary policy since it governs how much and at what interest rate banks extend credit.
- Central banks use various tools and strategies to influence the money supply and interest rates, which in turn impact economic activities and overall economic conditions.
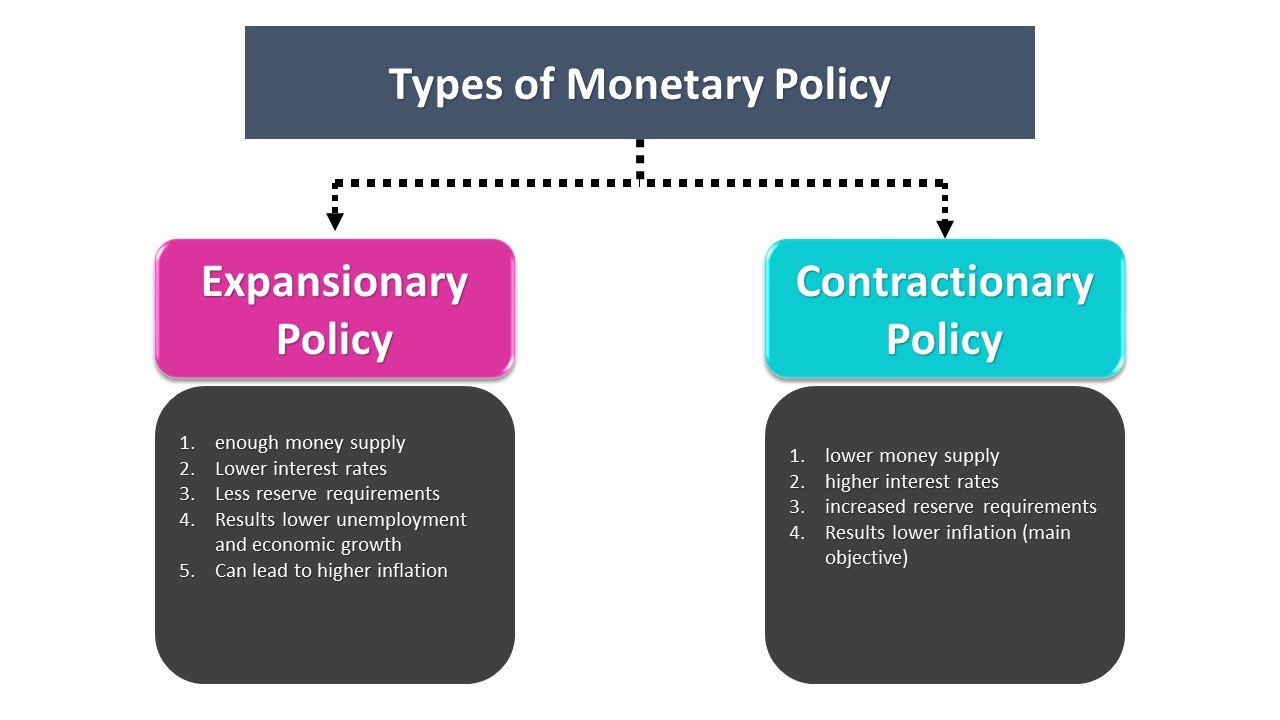
Types of Monetary Policy
There are two types of monetary policy:
1) Expansionary Policy
- An expansionary policy boosts economic activity during slowdowns or recessions.
- Expansionary policy works by increasing the total money supply in the economy.
- The money supply in the economy is increased by lowering the general interest rates on loans and other forms of debt.
- When there are low interest rates, people tend to save less, and consumer spending and borrowing increase. Thus, it is used to stimulate economic growth.
2) Contractionary Policy
- Contractionary policy decreases the total supply of money in the economy by increasing the interest rates.
- It is used to reduce prices caused by an excess money supply.
Objectives of Monetary Policy
- Monetary policy is concerned with making money available to the market at reasonable rates and in sufficient quantities at the appropriate time in order to achieve:
- Price stability
- Accelerating the growth of economy
- Exchange rate stabilization
- Balancing savings and investment
- Generating employment
- Financial stability
- The primary goal of monetary policy is to maintain price stability while keeping growth in mind. Price stability is a prerequisite for long-term growth.
- In order to maintain price stability, inflation must be kept under control.
- Every five years, the Indian government sets an inflation target. The Reserve Bank of India (RBI) plays an important role in the consultation process for inflation targeting.
- The current inflation-targeting framework in India is flexible.
Monetary Policy in India
- In India, the monetary policy of the Reserve Bank of India aims to control the amount of money in circulation in order to meet the requirements of various economic sectors and quicken the rate of economic expansion.
- Historically, in India, monetary policy was announced twice a year, once during the slack season (April-September) and once during the busy season (October-March), in accordance with agricultural cycles.
- However, because monetary policy has become more dynamic, the Reserve Bank of India decided to issue a bi-monthly Monetary Policy.
- Statements—once every two months—beginning in 2014, as recommended by the Urjit Patel Committee.
How does the RBI get its Mandate to conduct Monetary Policy?
- The Reserve Bank of India (RBI) controls the monetary policy and this mandate is clearly mentioned in the Reserve Bank of India Act, 1934.
- The Monetary Policy Department of the RBI assists the Monetary Policy Committee (MPC) in formulating the monetary policy of the nation.
- For this, the RBI uses a variety of tools to carry out monetary policy, including open market operations, bank rate policy, reserve system, credit control policy, and moral persuasion.
- There have recently been many changes in the way India’s monetary policy is formed, with the introduction of the Monetary Policy Framework (MPF), Monetary Policy Committee (MPC), and Monetary Policy Process (MPP).
Monetary Policy Framework
- In May 2016, the RBI Act, 1934 was amended to provide a statutory basis for the implementation of the flexible inflation targeting framework.
- Inflation Target: Under Section 45ZA, the Central Government, in consultation with the RBI, determines the inflation target in terms of the Consumer Price Index (CPI), once in five years and notifies it in the Official Gazette. Accordingly, on August 5, 2016, the Central Government notified in the Official Gazette 4 per cent Consumer Price Index (CPI) inflation as the target for the period from August 5, 2016 to March 31, 2021 with the upper tolerance limit of 6 per cent and the lower tolerance limit of 2 per cent. On March 31, 2021, the Central Government retained the inflation target and the tolerance band for the next 5-year period – April 1, 2021 to March 31, 2026.
- Section 45ZB of the RBI Act provides for the constitution of a six-member Monetary Policy Committee (MPC) to determine the policy rate required to achieve the inflation target.
- Failure to Maintain Inflation Target: The Central Government has notified the following as the factors that constitute failure to achieve the inflation target: (a) the average inflation is more than the upper tolerance level of the inflation target for any three consecutive quarters; or (b) the average inflation is less than the lower tolerance level for any three consecutive quarters.
o Where the Bank fails to meet the inflation target, it shall set out in a report to the Central Government:
a. the reasons for failure to achieve the inflation target;
b. remedial actions proposed to be taken by the Bank; and
c. an estimate of the time-period within which the inflation target shall be achieved pursuant to timely implementation of proposed remedial actions. - The operating framework of monetary policy aims at aligning the operating target – the weighted average call rate (WACR) – with the policy repo rate through proactive liquidity management to facilitate transmission of repo rate changes through the entire financial system, which, in turn, influences aggregate demand – a key determinant of inflation and growth.
Instruments of Monetary Policy
Monetary policy is implemented using a variety of direct and indirect instruments:
-
Repo Rate
-
Repo Rate is the (fixed) interest rate at which the Reserve Bank provides overnight liquidity to banks in exchange for the government and other approved securities as collateral under the liquidity adjustment facility (LAF).
-
Reverse Repo Rate
-
Reverse Repo Rate is the (fixed) interest rate at which the Reserve Bank absorbs liquidity from banks on an overnight basis in exchange for eligible government securities under the LAF.
-
Liquidity Adjustment Facility (LAF)
- Liquidity Adjustment Facility (LAF) is made up of both overnight and term repo auctions.
- The Reserve Bank has gradually increased the proportion of liquidity injected through fine-tuning variable rate repo auctions of various tenors.
- The goal of term repo is to help develop the inter-bank term money market, which in turn can set market-based benchmarks for loan and deposit pricing and thus improve monetary policy transmission.
- The Reserve Bank also conducts variable interest rate reverse repo auctions as market conditions dictate.
-
Marginal Standing Facility (MSF)
- Marginal Standing Facility (MSF) is the facility through which scheduled commercial banks can borrow an additional amount of overnight money from the Reserve Bank by dipping into their Statutory Liquidity Ratio (SLR) portfolio up to a certain limit at a penal rate of interest.
- This acts as a safety valve for the banking system in the event of unexpected liquidity shocks.
-
Corridor
- The corridor for the daily movement in the weighted average call money rate is determined by the MSF rate and the reverse repo rate.
-
Bank Rate
- Bank Rate is the rate at which the Reserve Bank is willing to purchase or rediscount bills of exchange or other commercial papers.
- Section 49 of the Reserve Bank of India Act, 1934 mandates the publication of the Bank Rate.
- This rate has been aligned with the MSF rate and, as a result, changes automatically when the MSF rate and the policy repo rate change.
-
Cash Reserve Ratio (CRR)
- Cash Reserve Ratio (CRR) is the average daily balance that a bank is required to maintain with the Reserve Bank as a share of such percentage of its Net Demand and Time Liabilities (NDTL) as specified by the Reserve Bank in the Gazette of India from time to time.
-
Statutory Liquidity Ratio (SLR)
- Statutory Liquidity Ratio (SLR) is the percentage of NDTL that a bank must keep in safe and liquid assets such as unencumbered government securities, cash, and gold.
- SLR changes frequently have an impact on the availability of resources in the banking system for lending to the private sector.
-
Open Market Operations (OMOs)
- Open Market Operations (OMOs) include the outright purchase and sale of government securities for the purpose of injecting and absorbing long-term liquidity, respectively.
-
Market Stabilisation Scheme (MSS)
- Market Stabilisation Scheme (MSS) is a monetary management tool that was introduced in 2004.
- Short-term government securities and treasury bills are sold to absorb longer-term surplus liquidity resulting from large capital inflows.
- The money raised in this manner is kept in a separate government account of the Reserve Bank.
Monetary Policy Framework (MPF)
- While the Government of India establishes the Flexible Inflation Targeting Framework in India, the Reserve Bank of India (RBI) is in charge of the country’s Monetary Policy Framework.
- The amended RBI Act explicitly gives the Reserve Bank the legislative mandate to run the country’s monetary policy framework.
- The framework aims to set the policy (repo) rate based on an assessment of the current and evolving macroeconomic situation, as well as to modulate liquidity conditions in order to anchor money market rates at or near the repo rate.
- Changes in repo rates are transmitted through the money market to the entire financial system, influencing aggregate demand – a key determinant of inflation and growth.
- Once the repo rate is announced, the Reserve Bank’s operating framework envisions day-to-day liquidity management through appropriate actions aimed at anchoring the operating target – the weighted average call rate (WACR) – around the repo rate.
Monetary Policy Committee (MPC)
- The Monetary Policy Committee (MPC) is the committee set up by the Union government to set the policy interest rates as a part of its monetary policy.
- It is headed by the Governor of the Reserve Bank of India (RBI).
- The Monetary Policy Committee’s decisions will impact the money supply and liquidity in the economy.
- The MPC is a six-person committee appointed by the Central Government (Section 45ZB of the amended RBI Act, 1934).
- The MPC must meet at least four times per year. The MPC meeting requires a quorum of four members. Each MPC member has one vote, and in the event of a tie, the Governor has a second or casting vote.
- Following the conclusion of each MPC meeting, the resolution adopted by the MPC is published.
|
Present Monetary Policy Committee The Central Government constituted the present MPC as under: 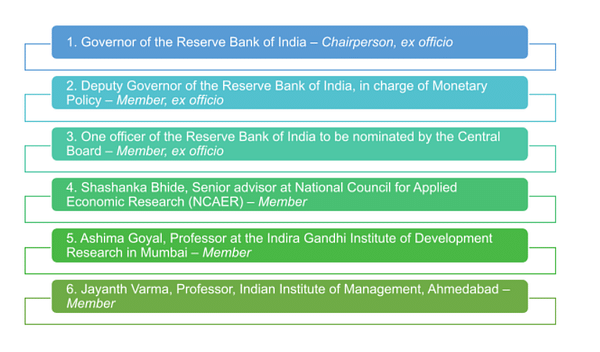 Note: Members referred to at point 4, 5, and 6 above, will hold office for a period of four years or until further orders are issued, whichever is earlier. |
Conclusion
Monetary policy decisions are typically made by a central bank’s monetary policy committee or board of governors. The effectiveness of monetary policy depends on a variety of factors, including the economic conditions, government fiscal policies, global economic trends, and financial market dynamics.
Central banks often use a combination of these tools to achieve their policy objectives and maintain a stable and healthy economy.
Mains Questions
Q. What is Monetary Policy? Describe the two types of Monetary Policy? (150 Words) 10 Marks
Chapter 13: Indian Financial Systems - Overview and Components

Introduction
The Indian Financial System plays a very important role in the Indian Economy and it shows the economic growth of our economy. This chapter covers all the government sector exams in our economy. It helps in the flow of funds to people and the people use this money economically for their betterment.
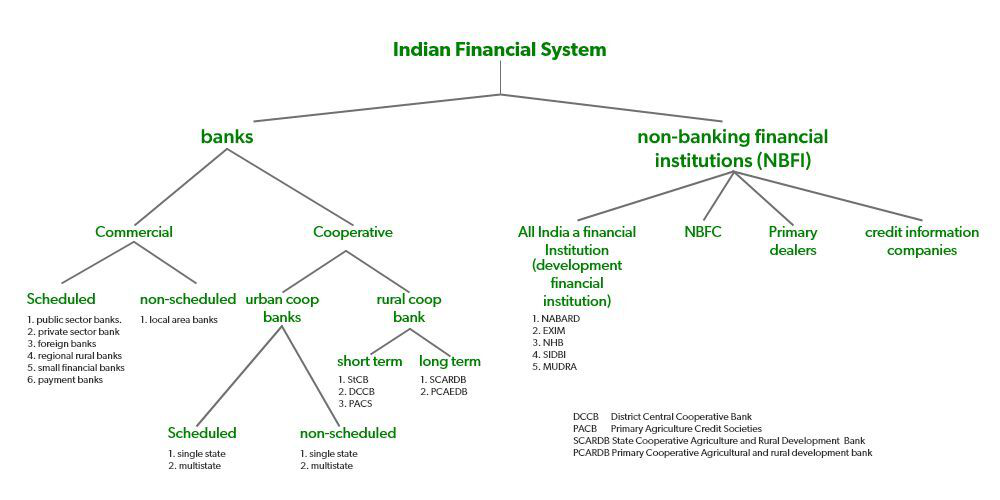
Indian Financial System – Overview
The various type of services that are provided by financial institutions like banks, insurance companies, pensions, fund etc. to the people of the country makes a financial system.
1. The Financial Institutions in India are broadly divided into two categories viz. Banks and Non-Banking Financial Institutions (NBFI). A bank accepts demand deposits while NBFIs do not accept them. The banks have been authorised to issue checks but NBFIs cannot issue them.
2. Banks are classified into commercial and cooperative. Commercial banks operate their business for profit purposes while the basis of operation for cooperative banks is on cooperative lines i.e. service to its members and the society. In comparison to a commercial bank, Cooperative banks provide a higher rate of interest.
Commercial banks are of two categories viz.
a) Scheduled commercial banks
b) Non-scheduled commercial banks.
A scheduled bank is a bank that has been included in the 2nd schedule of the RBI Act 1934. A scheduled bank also had to be a corporation and the Paid-up capital for it should be at least Rs. 500 crores.
The Non-Scheduled banks have to put some reserve requirements like SLR, and CRR according to the banking regulation act 1949. Scheduled Banks are required to maintain reserve requirements with RBI as per the RBI Act 1934.
3. Co-operative Banks: These are of two types-
a) Urban Co-operative banks (UCB)
b) Rural Co-operative banks.
The Urban Co-operative banks (UCB) are also known as Primary Co-operative Banks. They help the communities, and localities workplace groups and are set up mostly in urban and semi-urban areas. Their main customers are mainly small borrowers and businesses.
These UCBs are also classified into Scheduled and Non-scheduled categories, which are then further classified into a single state and multi-state.
4. Public Sector Banks:
Banks are controlled by the federal or state governments, with a combined ownership of more than 51 percent. SBI and its affiliates, Punjab National Bank, Bank of India, and others are examples. Those Nationalized Banks (private banks taken over by the government) which were nationalized in 1969 and 1980s are also public sector banks as the government owns more than 51% of these banks.
5. Private Sector Banks:
These are those Indian Banks that are owned by private individuals for example ICICI bank, HDFC bank, Axis Bank etc.
6. Foreign Banks:
Those Banks that are established and provided services of banking in India but are owned by foreign entities are called foreign banks. for example, Citi Bank, HSBC Banks, Standard chartered banks etc.
7. Regional Rural Banks (RRBs):
The Regional Rural Banks Act of 1976 established RRBs in 1975 with the goal of developing the rural economy by providing credit and other facilities, particularly to small and marginal farmers, agricultural labourers, artisans, and small entrepreneurs, for the purpose of developing agriculture, trade, commerce, industry, and other productive activities in rural areas. The national government, the concerned state government, and the sponsor bank each own 50:15:35 of RRBs (each RRB is sponsored by a particular bank). RRBs are required to distribute 75% of their funding to priority industries. NABARD also supervised RRBs.
8. Local Area Banks (LAB):
They were established in 1996 as part of a Government of India scheme. The government intended to establish new private local banks with control over two or three adjacent areas. The goal of establishing local area banks was to allow local institutions to mobilise rural savings and make them available for investments in local areas. There are just four Non-Scheduled Local Area Banks in India, one of which is Coastal Local Area Bank in Vijayawada, Andhra Pradesh.
The RBI regulates and supervises three main areas of the Non-Banking Financial Institutions (NBFIs) sector in India: All India Financial Institutions (AIFIs), Non-Banking Financial Companies (NBFCs), and Primary Dealers (PDs). Credit Information Companies (CIC) are a type of non-banking financial organisation regulated by the Reserve Bank of India.
9. AIFIs are institutional mechanisms tasked with delivering long-term finance to specific sectors. The RBI currently regulates and supervises four AIFIs, also known as Development Financial Institutions (DFIs).
10. NABARD:
NABARD was established in 1982 under the provisions of the National Bank for Agriculture and Rural Development Act 1981. NABARD gives credit to promote agriculture, small scale industries, cottage and village industries, handicrafts and other rural crafts and other allied economic activities in rural areas. NABARD extends assistance to the government, RBI and other organizations in matters relating to rural development. It offers training and research facilities for banks, cooperatives and organizations in matters relating to rural development
11. Small Industries Development Bank of India (SIDBI):
SIDBI was established in 1990 under the provisions of the Small Industries Development of India Act 1989 SIDBI serves as the primary financial institution for promoting, funding, and developing the Micro, Small, and Medium Enterprise (MSME) sector, as well as for coordinating the functions of other organisations involved in similar activities. SIDBI primarily provides banking institutions with indirect financial support (in the form of refinancing) in order for them to lend to MSMEs.
12. MUDRA Bank:
MUDRA (Micro Units Growth and Refinance Agency Ltd.) is a government-owned financial agency dedicated to the development and refinancing of micro-enterprises. MUDRA Ltd, a non-banking finance company, has been set up as a subsidiary of SIDBI pending the passing of an act creating MUDRA Bank. MUDRA’s goal is to provide funding to non-corporate (informal sector) small businesses in rural and urban areas with financing needs of up to Rs 10 lakhs, such as small manufacturing units, shopkeepers, etc. MUDRA would be in charge of refinancing all Last Mile Financiers, including Micro Financial Institutions, Non-Banking Finance Companies, Societies, Trusts, Companies, Co-operative Societies, Small Banks, Scheduled Commercial Banks, and Regional Rural Banks, who lend to micro/small business entities engaged in manufacturing, trading, and services.
13. Non-Banking Financial Companies (NBFCs):
The NBFC is a company governed by the Companies Act, 1956/2013, that deals with loans and advances, the acquisition of shares/bonds/debentures issued by the government or a local authority, or other marketable securities of a similar nature, leasing, hire-purchase, insurance, and chit business, but not with agriculture, industrial activity, or the purchase or sale of any goods. Private sector institutions make up the majority of NBFCs.
14. Primary dealers (PDs):
Primary dealers are RBI-registered companies with the authority to buy and sell government securities. In the primary market, PDs purchase government securities directly from the government (RBI issues these assets on behalf of the government), with the intention of reselling them to other buyers in the secondary market. As a result, they play an important role in the primary and secondary government securities markets.
15. Credit Information Companies (CIC):
A CIC is a non-profit organisation that accepts banks, NBFCs, and financial institutions as members and collects data and identity information for individual customers and enterprises. CICs tell banks whether or not a potential borrower is creditworthy based on his payment history. The ability of lenders to assess risk and of consumers to receive credit at competitive rates is determined by the quality of information available. The RBI regulates and licenses credit information companies (CICs) under the Credit Information Companies (Regulation) Act 2005. TransUnion Credit Information Bureau of India Limited (CIBIL), Equifax, Experian, and High Mark Credit Information Services are the four CICs currently operating in India.
16. Payment Banks:
In August 2015, the Reserve Bank of India (RBI) approved 11 applications for Payment Bank licenses. The Reserve Bank of India has capped the amount of deposits that payment banks can receive from individuals at Rs. 1 lakh. Only those companies that are truly engaged in targeting the poor will be able to apply for payment bank licenses as a result of this restriction. As a result, migrant workers, self-employed individuals, low-income households, and others will be the primary beneficiaries of payment banks’ low-cost savings accounts and remittance services, allowing those who currently transact only in cash to make their first foray into the formal banking system (payment banks will not be permitted to lend or issue credit cards). Only demand deposits will be accepted by payment banks.
17. Small Finance Banks:
In September 2015, RBI granted licenses to 10 applicants for Small Finance Banks which is a step in the direction of furthering financial inclusion.
The small finance banks shall primarily undertake basic banking activities of acceptance of deposits and lending to unserved and underserved sections including small business units, small and marginal farmers, micro and small industries and unorganized sector entities.
Components of Indian Financial System
Financial institutions
The term financial institution defines those institutions which provide a wide variety of deposit, lending, and investment products to individuals, businesses, or both. Some other financial institutions provide services and account for the general public, others are more likely to serve only certain consumers with more specialized offerings.
1. Central Banks
These are the financial institutions that regulate, oversight and look after the management of all other banks. RBI is known as the central bank of India. An individual does not have direct contact with a central bank instead, large financial institutions work directly with the RBI to provide products and services to the general public.
2. Retail and Commercial Banks
These Banks provide products to consumers and commercial banks worked directly with businesses. At present, most banks offer deposit accounts, lending and financial advice. These banks cater for services like checking and savings accounts, certificates of deposit (CDs), personal and mortgage loans, credit cards, and business banking accounts.
3. Internet Banks
These types of banks work the same as retail banks. Internet bank is of two type-
• Digital banks- These are online-only platforms affiliated with traditional banks.
• Neo banks- These banks are not affiliated with any bank but themselves. These are pure digital native banks.
4. Credit Unions
These are the financial institution that was founded and administered by its member and provide standard banking services.
These unions help a specific population based on their field of membership, such as military personnel or teachers.
5. Insurance Companies
These companies help individuals in transferring the risk of loss. These companies take care of individuals and businesses from financial loss caused due to disability, death, accidents, property damage and other catastrophes.
Financial Markets
The marketplace where buyers and sellers participate in the trade of assets such as equities, bonds, currencies, and derivatives.
There are 2 types of Financial Markets:
1. Money Market – deals in short-term credit (< 1 yr).
2. Capital Market –handles medium-term & long-term credit. (> 1 yr).
Money Market:
It is characterized by two sectors:
1. Organized sector – this sector comes within the direct purview of RBI. It includes banking & sub-markets.
a. Banking sector – Commercial banks [under Banking regulation act 1949 & consist of both private & public], RRBs, Cooperative Banks.
b. Sub Markets – Meet the need of govt and industries. It includes call money, Bill market [Commercial bill, T-Bill], Certificate of Deposit [CD] & Commercial Paper [CP].
2. Unorganized sector – consists of indigenous bankers, money lenders, non-banking financial institutions, etc.
Capital Market:
This market comprises buyers & sellers, who trade in equity (ownership of asset) &debt (loan). It is regulated by SEBI (established in 1992).
The institutions in the capital market are called NBFCs (Non-banking financial companies). But it’s not necessary that all NBFCs are capital market institutions.
RBI defines NBFC as – ‘A NBFC is a company registered under the Companies Act, 1956 and is engaged in the buss of loans & advances, acquisition of share/ stock issued by Government. It doesn’t include any institution whose principal buss is agriculture activity, industrial activity, or sale/purchase of the immovable property.
Security Market:
This market is known as-
a) Government Securities [gilt edge] security market and
b) Industrial Security Market [New Issue Market is the primary market & Old Issue Market is the secondary market].
Development Financial Institutions: They provide long-term loans to industries engaged in infrastructure where projects have long gestation periods & require long term loans.
Financial services:
The purpose of Financial Services is to cater for a person with borrowing, selling or purchasing securities, allowing payments and settlement, lending and borrowing. These services help in the management of funds as the money is invested efficiently and also help to get the required funds. These services are provided by the assets management and liability management companies.
These services are-
• Banking services- like cash deposit, issuing debit and credit cards, opening accounts, Fixed deposit, loan facility etc.
• Insurance services- like issuing of insurance, selling policies, insurance undertaking and brokerages, etc.
• Foreign exchange services- currency exchange, foreign exchange, etc.
• Investment services- like asset management etc.
Chapter 14: Money Supply

Introduction
Money Supply means the total amount of money and other liquid assets in a country’s economy in circulation. Banking regulators regulate the money supply through policy and regulatory actions in order to maintain economic stability. Money supply data is collected and published because it influences the price level, inflation, the exchange rate, and the business cycle. “Supply of Money” is one of the important concepts in the UPSC/IAS 2023 Economy syllabus which is discussed in this article in detail.

What is Supply of Money?
- The total stock of money circulating in an economy is referred to as the supply of money.
- In layman’s terms, it is defined as currency in circulation plus deposits in commercial banks.
- The supply of Money consists of the following:
- The total currency circulating in the public
- Non-bank deposits with a commercial bank
- Currency in circulation is the total value of all currency (coins and paper currency) issued by the Reserve Bank of India minus the amount withdrawn by it. It is a significant liability on a central bank’s balance sheet.
- Currency in circulation (currency with the public) includes the following:
- Currency notes and coins with the public
- Cash in hands with banks
- Money supply plays a crucial role in the determination of price level and interest rates.
- The growth of the money supply helps in the acceleration of economic development and price stability.
- Credit control policies imposed by a country’s banking system aid in determining the total supply of money.
- The monetary base and the money multiplier ultimately determine the money supply.
- Monetary policy has an effect on the money supply as well.
- The expansionary policy raises the total supply of money in the economy faster than usual, while contractionary policy raises the total supply of money more slowly than usual.
- Expansionary policies are used to combat unemployment, whereas contractionary policies are used to slow inflation.
Effects of Money Supply on Economy
- The money supply, or total cash present in a country’s economy, is bound to have an impact on market economics. As a result, any change in the demand and supply of money will cause a change in the market.
- A rise in the money supply will be reflected in lower interest rates and prices of commodities and service.
- A decrease in the money supply will result in higher interest rates and prices, with a corresponding increase in bank reserves.
- A similar effect occurs in the business. As the price level falls due to increased money supply, the business output will rise to accommodate people’s increased spending.
- As a result, the money supply and money demand have a direct impact on the macroeconomics of a country’s market.
Components of Money Supply
Currency
- Currency is a significant component of a country’s money supply. As previously stated, the government issues currency in two forms: coins and paper currency. As a result, the money supply via currency can also be divided into:
- Paper Currency/Notes – The government and the Reserve Bank of India have control over the production of currency notes. The government produces only one-rupee paper currency in the country, while the RBI produces all other currency notes.
- Coins – Coins, India’s second form of currency, are produced in two varieties: token coins and standard coins, also known as full-bodied coins. Under the current currency system, full-bodied currency coins have little value. The token coins have a face value of 50 paise and25 paise.
Demand Deposits
- Demand deposits are a type of commercial bank deposit that serves as a non-confidential fund.
- When a country’s economy includes these accounts, they are considered money.
- The working mechanism of such deposits is similar to that of a checking account, where withdrawals from the fund can be made without notice.
Measures of Money Supply
- The RBI publishes figures for four different measures of money supply, namely M1, M2, M3, and M4. They are defined as below:
- M1 = CU + DD
- M2 = M1 + Savings deposits with Post Office savings banks
- M3 = M1 + Net time deposits of commercial banks
- M4 = M3 + Total deposits with Post Office savings organizations (excluding National Savings Certificates)
- where CU is public currency (notes and coins) and DD is net demand deposits held by commercial banks. The term ‘net’ implies that only public deposits held by banks are to be included in the money supply.
- M1 and M2 are referred to as narrow money.
- M3 and M4 are referred to as broad money.
- M1 is the most liquid and easiest to transact with, whereas M4 is the least liquid.
- M3 is the most commonly used money supply measure. It’s also referred to as aggregate monetary resources.
Reserve Money (M0)
- Reserve money is also referred to as central bank money, monetary base money, base money, or high-powered money.
- Reserve money is all of the cash in the economy and is denoted by M0.
- It includes the following components:
- Currency with the public
- Other Deposits with the RBI
- Banks’ cash reserves held with themselves
- Banks’ cash reserves held with the RBI
- Cash Reserves are classified into two types: Required Reserves (RR) and Excess Reserves (ER).
- RR is the reserves that banks are legally required to keep with the RBI.
- Excess Reserves are all reserves in excess of RR.
- ER is held by banks, whereas RR is held by the RBI.
- Banks hold the ER to cover currency drains, i.e., currency withdrawals by depositors.
Factors Affecting Money supply
Monetary Base
- When the reserve moneychangers, the money supply changes in the same direction. This means that as more reserve money enters the system, the money supply expands and vice versa.
- In most countries, the size of the monetary base is determined by the central bank.
- The monetary base includes vault reserves as well as currency in circulation outside of banks.
- Central banks may alter reserve requirements in order to alter the monetary base.
Money Multiplier
- Money Multiplier is the ratio of Narrow Money (M1) or Broad Money (M3)to Reserve Money.
- A money multiplier method is used to demonstrate the maximum amount of broad money that commercial banks could create for a given fixed amount of base money and reserve ratio.
Supply Curve of Money
- The money supply curve depicts the relationship between the quantity of money supplied and the market interest rate, with all other supply determinants remaining constant.
- The money supply is solely determined by the central bank and is unaffected by interest rates.
- As a result, the money supply curve is vertical at the quantity of money supply, rather than upward or downward sloping.
- Since the central bank has control over the money supply, it can take actions to increase or decrease the money supply. Changes in the money supply cause interest rates to fluctuate.

Conclusion
Money supply has a significant impact on a country’s economy. The inflation of commodity prices, as well as their demand and supply, alter the supply of money. In economics, the money supply influences interest rates and cash flow throughout the country.
Chapter 15: Monetary Policy Transmission
Introduction
The transmission of monetary policy describes how changes made by the Reserve Bank to its monetary policy settings flow through to economic activity and inflation.
This process is complex and there is a large degree of uncertainty about the timing and size of the impact on the economy.
In simple terms, the transmission can be summarised in two stages.
- Changes to monetary policy affect interest rates in the economy.
- Changes to interest rates affect economic activity and inflation.
What is Monetary Policy Transmission?
- Monetary policy transmission is the process by which the central bank’s policy action is transmitted in order to achieve the ultimate goals of inflation and growth.
- For instance, if the RBI reduces the policy rates then the benefits of reduced lending rates must be passed on to the customers.
- However the reality is different, the monetary policy was not transmitted to the customers in the internal benchmark era.
- The below table summarises the monetary policy transmission before and after the introduction of External Benchmark Lending Rates.

Monetary Policy Transmission Mechanism in India
- In the Indian context, the repo rate has a significant impact on the momentary policy transmission.
- The repo rate serves as the anchor rate in determining the economy’s interest rate (of the banking system).
- Now, how far a change in repo rate can cause a corresponding change in interest rate by banks is dependent on the banking system’s financial conditions.
- In this regard, the banking system is central to India’s monetary policy transmission.
- In general, there are two steps to the policy transmission mechanism:
- In the financial markets, there is a transmission from the policy rate to key rates.
- Transmission through financial markets to final objectives such as inflation, employment, and output.
Channels of Transmission
Changes in the central bank’s policy rate have a lag effect on the economy through a range of channels, the most important of which are:
Interest Rate
- Empirical studies suggest that call money rates and interest rates in areas, such as the government debt market, credit market or equities market, and the currency market, are bi-directionally related.
- Furthermore, studies have demonstrated that policy rate transmission through this channel is asymmetric, i.e., the level of policy rate transmission varies depending on whether there is a liquidity surplus or a liquidity deficit, with transmission being more successful during the liquidity deficit conditions.
- One reason could be that banks would be more reliant on RBI liquidity during times of constrained liquidity, making them more susceptible to RBI-influenced short-term interest rates.
Credit
- Even if the role of equities and debt markets has grown in recent years, India remains a banking-dominated economy.
- Because of the high reliance on bank funding, the bank lending and balance sheet channels are particularly crucial for monetary transmission.
- Credit growth appears to have an inverse relationship with policy rate fluctuations in terms of balance sheet implications.
- The annualized growth in nominal and real bank credit was lowered by 2.78 and 2.17 percent, respectively, by a 100 basis point rise in the policy rate.
Exchange Rate
- Consumption switching between domestic and foreign goods is how the exchange rate channel works.
- In India, this pathway is weak, with some indications of exogeneity. This is due to India’s weak integration with global financial markets and the Reserve Bank of India’s interference in Forex markets.
- Despite this, it is discovered that currency rate depreciation is a major source of inflation risk.
Asset Price
- Asset prices, particularly stock prices, react to interest rate changes, according to empirical evidence for India, however, the amount of the influence is minor.
- The asset price transmission channel has improved as the usage of formal finance for real estate acquisition has increased.
- During periods of high inflation, however, consumers have a tendency to shift away from bank savings and toward other types of savings such as gold and real estate, which tend to provide a superior inflation hedge.
- Because these acquisitions are financed through informal channels, they may be less responsive to contractionary monetary policy, weakening India’s asset price channel.
Monetary Policy Transmission – Significance
- The process of monetary policy transmission affects economic growth, prices, and other aspects of the economy.
- Due to central banks raising the official interest rate, bank lending rates and bond yields will rise.
- Changes in the official interest rate are one way for central banks to influence the cost of borrowing for businesses and consumers.
- The discount rates used to compute the present value of cash flows, which are used to estimate the value of securities, are affected by changes in the official interest rate.
- Official interest rate changes have a substantial impact on economic actors’ expectations.
- Economic agents would expect lending to increase as a consequence of lower borrowing costs, or asset prices to rise as a result of lower discount rates and expectations of stronger growth if official interest rates were cut.
- Changes in the official interest rate have an impact on exchange rates. When interest rates in a country rise, investment in that country becomes more appealing, all other factors being equal.
Challenges to Monetary Policy Transmission
Inflexible Funding Costs
- In India, customer deposits account for the vast majority of funds lent by banks, while market borrowings through the issuance of debentures/commercial papers are insignificant.
- Because most of these deposits are contracted at fixed rates, the cost of funds is typically fixed.
- Furthermore, interest rates on small savings remained high when compared to bank rates. This has resulted in a decrease in bank deposits.
- Because of the lack of funds, banks have been unable to lend at lower deposit rates.
- Banks will be unable to transmit monetary policy signals at the desired speed and magnitude until and unless this issue is addressed.
Policy rates are not linked to the market
- Because the repo rate is administered by the Monetary Policy Committee, it cannot be considered a market-determined rate.
- Banks are being asked to link their lending rates to the repo rate, with no regard for the cost of lending funds.
Nearly three-fourths of the outstanding loans are not linked to external benchmarks
- The share of outstanding loans linked to external benchmarks has risen from 2.4% in September 2019 to 28.5 percent in March 2021.
High levels of non-performing assets (NPAs)
- Bank profitability has suffered as a result of the accumulation of large NPAs.
- As a result, banks keep the weighted average lending rate significantly higher than the marginal lending rate.
Four Balance Sheet Problems
- According to Arvind Subramanian, former chief economic advisor, India’s economic slowdown is facing a “four balance sheet challenge.”
- The original two sectors (infrastructure companies and banks) are included in the Four Balance Sheet Challenge, as well as NBFCs and real estate companies.
- This has hampered credit growth in India and, as a result, the greater transmission of monetary policy.
Conclusion
Over the years, the Reserve Bank’s efforts to improve transmission to the bank deposit and lending rates have begun to bear fruit, particularly with the implementation of the external benchmark system.
The external benchmark system has incentivized banks to adjust their term and savings deposit rates as lending rates are frequently adjusted in line with the benchmark rates, in order to protect their net interest margins, thereby broadening the scope of transmission across sectors that are not even linked to the external benchmark.
Nonetheless, several impediments to transmission to lending rates remain, necessitating quick resolution.
Mains Questions
Q. Despite the best efforts of RBI, the effects of Monetary Policy Transmission seems impossible. Comment (150 Words) 10 Marks
Q. Describe the various tools with the RBI to effect the Monetary Policy Transmission? (150 Words) 10 Marks
Chapter 16: Banking Sector in India: An Overview
Introduction
A bank is a type of financial institution that primarily deals with deposit collection and loan distribution. Deposits and loans are very different in nature. Banks are regulated by the country’s central bank—in India, the RBI (Reserve Bank of India). Banking sector in India truly reflects a mixed economy, with public, private, and foreign banks.
In accordance with the liberalisation policy, reforms in the banking sector were launched concurrently in 1991, based on the recommendations of the Narasimham Committee.
Prior to 1991, banking, like the industrial sector, was heavily regulated and sheltered by the RBI. It became critical to reform the banking sector in order to support the liberalisation policy and allow for the growth of the private sector.
Historical Background
- The development of the banking sector can be divided into three stages:
- Phase I – Early Phase (1770 to 1969) which can be subdivided into Pre Independence Period (1786-1947) and Post Independence Period (1947-1969)
- Phase II – Nationalisation Phase (1969 to 1991)
- Phase III – Liberalisation or Banking Sector Reforms Phase (1991 – till date)
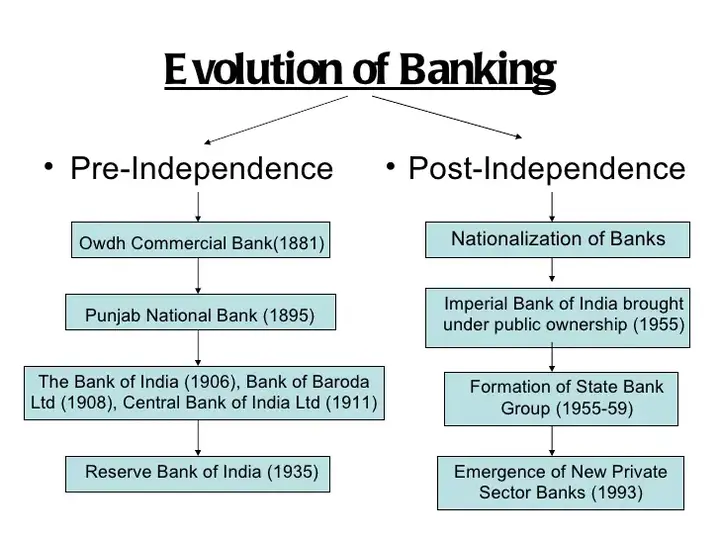
Pre-Independence Period (1786-1947)
- The “Bank of Hindustan,” established in 1770 in the then-Indian capital of Calcutta, was the country’s first bank. However, this bank did not succeed and closed its doors in 1832.
- Over 600 banks were registered in the country during the pre-independence period, but only a few survived.
- During British rule in India, the East India Company established three banks known as the Presidential Banks: The Bank of Bengal, the Bank of Bombay, and the Bank of Madras.
- These three banks were eventually merged into a single bank in 1921, which was known as the “Imperial Bank of India.”
- The Imperial Bank of India was later nationalised and renamed The State Bank of India, which is now the largest public sector bank in India.
Post-Independence Period (1947-1991)
- At the time of India’s independence, all of the country’s major banks were privately led, which was a source of concern because people in rural areas were still reliant on money lenders for financial assistance.
- To address this issue, the then-Government decided to nationalise the banks. The Banking Regulation Act of 1949 was used to nationalise these banks.
- The Reserve Bank of India, on the other hand, was nationalised in 1949.
- Following the formation of the State Bank of India in 1955, another 14 banks were nationalised between 1969 and 1991. These were the banks with more than 50 crores in national deposits.
- Another six banks were nationalised in 1980, bringing the total to twenty.
- Aside from the aforementioned 20 banks, seven SBI subsidiaries were nationalised in 1959.
- Except for the State Bank of Saurashtra, which was merged in 2008, and the State Bank of Indore, which was merged in 2010, all of these banks were merged with the State Bank of India in 2017.
Liberalization Period (1991-Till Date)
- Once the banks have been established in the country, regular monitoring and regulations must be followed in order to maintain the profits generated by the banking sector.
- The final or ongoing phase of the banking sector’s development is critical.
- To ensure the stability and profitability of the Nationalised Public Sector Banks, the Government decided to form a committee led by Shri. M Narasimham to oversee the various banking reforms in India.
- The introduction of private sector banks in India was the most significant development. The Reserve Bank of India granted licences to ten private sector banks to establish themselves.
Banking Structure in India
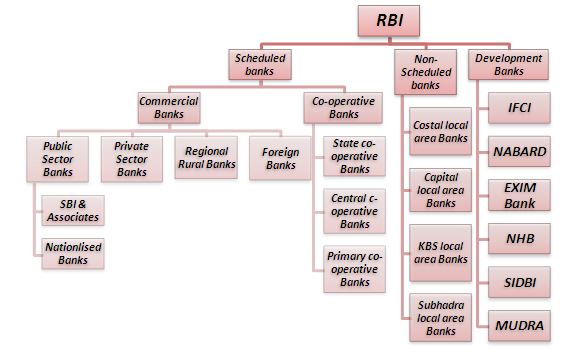
- The Indian banking system is divided into “Scheduled Banks” and “Non-scheduled Banks.”
- Schedule banks are those that are listed in the Second Schedule of the RBI Act, 1934 and thus meet the following requirements:
- a bank must have a paid-up capital and reserve of at least Rs. 5 lakh and
- a bank must satisfy the Reserve Bank of India (RBI) that its affairs are not conducted in a manner that is detrimental to the interest of its deposits.
- Non-scheduled banks are those that are not listed in the second schedule of the RBI Act, 1934 and thus do not meet the requirements outlined in that schedule.
- The term “scheduled banks” refers to both “scheduled commercial banks” and “scheduled cooperative banks.”
- The Scheduled commercial banks are further subdivided into four groups:
- Public sector banks (also known as “nationalised banks” and “State Bank of India (SBI) banks”);
- Private sector banks (divided into “Old Private Sector Banks” and “New Private Sector Banks” that emerged after 1991);
- Foreign banks in India; and
- Regional Rural Banks (that operate exclusively in rural areas to provide credit and other facilities to small and marginal farmers, agricultural workers, and small entrepreneurs).
- Foreign banks are present in the country either through full branch/subsidiary presence or through representative offices.
- Except for foreign banks, these scheduled commercial banks are registered in India under the Companies Act.
Role of RBI
- The RBI is the country’s supreme monetary and banking authority, and it controls the Indian banking system. It is known as the Reserve Bank because it holds the reserves of all commercial banks.
- In accordance with the provisions of the Reserve Bank of India Act, 1934, the Reserve Bank of India was established on April 1, 1935.
- The Reserve Bank’s Central Office was initially located in Calcutta but was permanently relocated to Mumbai in 1937. The Governor sits in the Central Office, where policies are developed.
- Though originally privately owned, the Reserve Bank has been wholly owned by the Government of India since its nationalisation in 1949.
- The RBI Nationalisation Act of 1949 has been amended several times by the government in response to changing needs, and its functions have been expanded.
- Its current functions can be objectively summarised as:
- Monetary policy formulation, implementation, and monitoring are all part of it. The overarching goal is to maintain price stability while pursuing growth.
- It issues new currency notes and coins (except for rupee one or its denominations, which are issued by the Ministry of Finance) as well as exchanging or destroying those that are no longer fit for circulation.
- This function also includes the responsibility for currency and coin distribution (of those ones also which are issued by the Ministry of Finance).
- The overarching goal is to maintain adequate supplies of quality currency and coins.
- It establishes broad parameters for banking operations within which the banking and financial system operates.
- This function’s overarching goal is to maintain public trust in the system, protect depositors’ interests, and provide cost-effective banking services to the public.
- Itmanagesthe FEMA (Foreign Exchange Management Act, 1999), keeping the country’s Forex (foreign exchange) reserves, stabilizing the rupee exchange rate, and representing the Government of India at the IMF and World Bank (and other international financial agencies of which India is a member).
- The goal of this function is to facilitate external trade and payments, as well as to promote the orderly development and maintenance of the country’s foreign exchange market.
- It introduces and upgrades safe and efficient payment systems in the country to meet the needs of the general public. The goal is to keep the public’s trust in the payment and settlement system.
- As a banker of the Government and the banks, it consists of three categories of functions:
- first, performing Merchant Banking functions for the central and state governments; second, acting as their Bankers; and third, maintaining banking accounts of the SCBs (scheduled commercial banks) operating in the country (domestic, foreign, public, and private).
- The broad objectives are to enable governments and banks to mobilise enough liquidity for their operations, under which it lends or manages government borrowing plans and provides short-term and long-term loans to banks (as Lender of Last Resort).
- As part of its developmental responsibilities, the RBI established developmental banks such as IDBI, SIDBI, NABARD, NEDB (North Eastern Development Bank), Exim Bank, and NHB.
- The ownership of these banks is gradually being transferred from the RBI to the Government of India.
Types of Banks
There are many types of banks in India, such as:
-
Commercial Banks
- Any banking organisation that deals with the deposits and loans of businesses is referred to as a commercial bank.
- Commercial banks issue bank checks and drafts and accept term deposits.
- Through instalment loans and overdrafts, commercial banks also serve as moneylenders.
- Commercial banks also provide a variety of deposit accounts, including checking, savings, and time deposits.
- These institutions are run for profit and are owned by a group of people.
Commercial Banks are further divided into the following:
- Public Sector Banks – These are banks in which the Government of India owns a majority stake. SBI, Bank of India, Canara Bank, and other public sector banks are examples.
- Private Sector Banks – The majority of a bank’s share capital is held by private individuals. These banks are set up as limited-liability corporations. Private sector banks include ICICI Bank, Axis Bank, HDFC, and others.
- Regional Rural Banks – Regional Rural Banks were established in accordance with the provisions of an Ordinance promulgated on September 26, 1975, and the RRB Act, 1976, with the goal of ensuring adequate institutional credit for agriculture and other rural sectors.
- RRBs can only operate in the areas that have been designated by Gol as covering one or more districts in the state.
- RRBs are jointly owned by Gol, the relevant State Government, and Sponsor Banks; the issued capital of an RRB is divided among the owners in the proportions of 50%, 15%, and 35%, respectively.
- Foreign Banks – These banks are registered and have their headquarters in another country, but they have branches in our country.
- Foreign banks in India include HSBC, Citibank, Standard Chartered Bank, and others.
-
Small Finance Banks
- The Small Finance Bank (SFB) is a private financial institution that primarily undertakes basic banking activities such as deposit acceptance and lending to unserved segments such as small business units, small and marginal farmers, micro and small industries, and unorganised sector entities, but without any geographical restrictions, unlike Regional Rural Banks or Local Area Banks.
-
Payment Banks
- A payment bank is a distinct type of bank that performs only the limited banking functions permitted by the Banking Regulation Act of 1949.
- Acceptance of deposits, payments and remittance services, internet banking, and acting as a business correspondent for other banks are examples of some oftheactivities.
- They are initially permitted to collect deposits of up to Rs 1 lakh per individual.
- They can help with money transfers as well as sell insurance and mutual funds. Furthermore, they can only issue ATM/debit cards, not credit cards.
- They are not permitted to establish subsidiaries to provide non-banking financial services. More importantly, they are not permitted to engage in any lending activities.
-
Co-operative Banks
- A cooperative bank is a financial entity that is owned and operated by its members, who are also its customers.
- Co-operative banks are frequently formed by people who belong to the same local or professional community or who share a common interest.
- Co-operative banks typically offer a wide range of banking and financial services to their members (loans, deposits, banking accounts, etc).
- It is further divided into:
- Urban Cooperative Banks
- Rural Cooperative Banks
Non-Banking Financial Institutions
- A Non-Banking Financial Company (NBFC) is a company registered under the Companies Act, 1956.
- A non-banking financial company, also known as a non-banking financial institution, provides financial services and products but is not recognised as a bank with a full banking licence.
- NBFCs are not banks, but their activities include lending and other activities such as providing loans and advances, credit facilities, savings and investment products, trading in the money market, managing stock portfolios, money transfers, and so on.
- NBFC Registration is required before NBFC activities can begin.
- Their activities include hiring, leasing, infrastructure finance, venture capital finance, housing finance, and so on.
- Deposits can be accepted by NBFC, but only term deposits and deposits repayable on demand are not accepted.
- Some examples of well-known NBFCs are Kotak Mahindra Finance, SBI Factors, Sundaram Finance, and ICICI Ventures.
Conclusion
Banks play an important role in an economy’s overall growth by lending to various sectors of the economy for expansion, diversification of existing businesses, and support of new businesses.
Chapter 17: Nationalisation of Banks
Introduction
Nationalization of banks is the process of converting a private stake into a public stake, essentially increasing the government’s share of the banking sector.
The primary goal of this move was to reduce the concentration of power and wealth in the hands of a few families who owned and controlled these financial institutions.
With the nationalisation of the Imperial Bank of RBI in 1955, the central government entered the banking business, taking a 60% stake and forming a new bank, SBI.
The nationalisation of banks broadened the scope of public sector banking, which had previously been limited to the State Bank of India.

What is Nationalisation of Banks?
- At the time of India’s independence, all of the country’s major banks were privately led, which was a source of concern because people in rural areas were still reliant on money lenders for financial assistance.
- To address this issue, the then-Government decided to nationalise the banks. The Banking Regulation Act of 1949 was used to nationalise these banks.
- The Reserve Bank of India, on the other hand, was nationalised in 1949.
- Following the formation of the State Bank of India in 1955, another 14 banks were nationalised between 1969 and 1991. These were the banks with more than 50 crores in national deposits.
- The 14 largest commercial banks were nationalised by then-Prime Minister Indira Gandhi in 1969.
- Another six banks were nationalised in 1980, bringing the total to twenty.
- Aside from the aforementioned 20 banks, seven SBI subsidiaries were nationalised in 1959.
- The government merged Punjab National Bank and New Bank of India in 1993. It was the only merger between nationalised banks, which reduced the number of nationalised banks from 20 to 19.
| Nationalised Banks | ||
|---|---|---|
| Between 1969-1991 | In 1980 | SBI Subsidiaries (In 1959) |
| 1) Allahabad Bank 2) Bank of India 3) Bank of Baroda 4) Central Bank of India 5) Bank of Maharashtra 6) Canara Bank 7) Dena Bank 8) Indian Overseas Bank 9) Indian Bank 10) Punjab National Bank 11) Syndicate Bank 12) Union Bank of India 13) United Bank 14) UCO Bank | 1) Andhra Bank 2) Corporation Bank 3) New Bank of India 4) Oriental Bank of Commerce 5) Punjab & Sind Bank 6) Vijaya Bank | 1) State Bank of Patiala 2) State Bank of Hyderabad 3) State Bank of Bikaner & Jaipur 4) State Bank of Mysore 5) State Bank of Travancore 6) State Bank of Saurashtra 7) State Bank of Indore |
Reasons for Nationalisation of Banks
- To boost private sectors – Banks were collapsing at an alarming rate – 361 banks failed between 1947 and 1955, equating to approximately 40 banks per year! Customers’ deposits were forfeited, and there was no way to recover them.
- To assist agricultural sector – Banks favored big industries and businesses while ignoring the rural sector. Nationalization was accompanied by a promise to support the agricultural sector.
- To grow India’s banking network – Nationalisation facilitated the establishment of new branches, ensuring that banks were well-represented throughout the country.
- To mobilize individual savings – Nationalizing the banks would give people more access to banks and encourage them to save, bringing in more revenue to a cash-strapped economy.
- Economic & Political Factors – The two wars in 1962 and 1965 had wreaked havoc on the economy. The nationalisation of Indian banks would boost the economy by increasing deposits.
Nationalisation of Banks – Significance
- The opening of new branches resulted in a significant increase in savings. Gross domestic savings nearly doubled as national income increased in the 1970s.
- Banks’ efficiency increased as a result of increased accountability. It also increased public trust.
- Small scale industries (SSIs) were given a boost, resulting in a proportionate improvement in the economy.
- Overall statistics for the banking sector and the Indian economy improved noticeably between 1969 to 1991.
- It reflected on parameters such as the share of bank deposits to GDP, the gross savings rate, the share of advances to DGP, and the gross investment rate.
- Banks were no longer limited to metropolitan areas. Branches were planted in the farthest reaches of the country.
- Banks’ expanded reach aided the growth of small businesses, agriculture, and the export sector. This expansion was accompanied by an increase in public deposits in proportion.
- The Green Revolution, one of the government’s top priorities, received a boost thanks to the assistance provided to the agricultural sector by newly nationalised banks.

Nationalisation of Banks – Criticism
- Socio-economic Challenges: Banks were unable to provide adequate support to eradicate poverty or finance the grassroots levels of society. This was especially noticeable in rural India.
- Private Bank Competition: Despite government support and increased impetus from increased deposits, public sector banks were never able to outperform private banks in terms of performance.
- Failure to Achieve Financial Inclusion: Despite the fact that financial inclusion was the primary goal of nationalising banks, it was not adequately enabled.
- It was accomplished only to a limited extent after the launch of a government campaign known as the Jan Dhan Yojana.
Conclusion
In the long run, the process of nationalisation resulted in economic stability and strengthened India’s economy. However, it was heavily criticized because it came at a time when India was at war with China and Pakistan, which fueled political resentment. Many argued that nationalising banks was a political ploy to undermine the business interests that backed her opponents.
Mains Questions
Q. It is said that the nationalization of banks in 1969 has done more harm than good to the Indian economy. Do you agree? Comment (150 Words) 10 Marks
Chapter 18: Non-Performing Asset

Introduction
Non-Performing Assets (NPA) are loans and arrears lent by banks or financial institutions whose principal and interests are delayed beyond 90 days. In simpler terms, any asset that ceases to provide returns to its investors for an extended period of time is referred to as a non-performing asset (NPA).

What are Non Performing Assets?
- When an asset no longer generates income for the bank, it is considered a non-performing asset.
- Previously, an asset was classified as a non-performing asset (NPA) based on the concept of “Past Due.”
- A ‘non-performing asset’ (NPA) was defined as a credit for which interest and/or principal instalments have been ‘past due’ for a specified period of time.
- To move toward international best practices and ensure greater transparency, ’90 days’ overdue norms for identifying NPAs were made applicable beginning with the fiscal year ended March 31, 2004.
- Commercial loans that are more than 90 days past due and consumer loans that are more than 180 days past due are typically classified as nonperforming assets by banks.
- In the case of agricultural loans, NPAs are declared if the interest and/or instalment or principal remain unpaid for two harvest seasons.
- However, this period should not be longer than two years. Any unpaid loan/instalment will be classified as NPA after two years.
Classification of Non Performing Assets
- Sub-standard: When the NPAs have aged <= 12 months.
- Doubtful: When the NPAs have aged > 12 months.
- Loss assets: When the bank or its auditors have identified the loss, but it has not been written off.
For Example, consider a commercial loan made on January 1st 2015 with repayment date of interest and principal amount on the 5th of every month. The firm stops its repayment and misses its repayments from January 2016.
- The loan is classified as an NPA if there is no repayment by April 5, 2016.
- If it is not repaid after that it is called a sub-standard asset till April 5, 2017.
- If the repayment due is past April 5, 2017, then it is classified as a doubtful asset.
- When the bank decides it no longer can recover this commercial loan it is classified as loss assets.
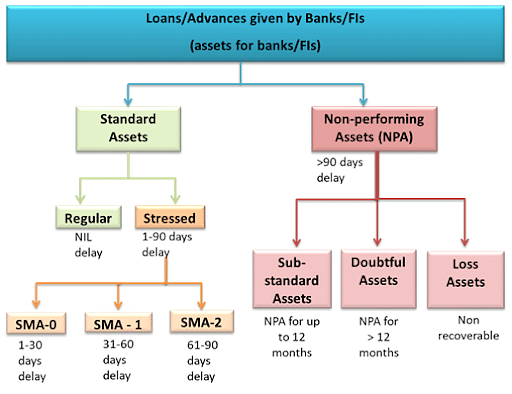
NPA Problem of India Banks
- Scheduled commercial banks’ net non-performing assets (NPA) ratio fell to a 10-year low of 3.9 per cent in March 2023, the Reserve Bank of India noted in the latest edition of its Financial Stability Report released Wednesday.
“Macro stress tests for credit risk reveal that SCBs are well-capitalized and all banks would be able to comply with the minimum capital requirements even under adverse stress scenarios,”
Willful Defaulter
- Any entity is considered a wilful defaulter when:
- The unit has failed to make its payment/repayment commitments to the lender, despite having the financial means to do so.
- The unit has failed to meet its payment/repayment commitments to the lender and has not used the lender’s funds for the specific objectives for which they were obtained, instead of diverting the money to other uses.
- The unit has failed to meet its payment/repayment commitments to the lender and has syphoned off the funds, such that the funds have not been used for the precise purpose for which credit was obtained, nor are the funds available in the form of other assets with the unit.
- The Banks have to submit the names of the Wilful defaulters to the Reserve Bank of India (RBI) with outstanding loans of more than 25 Lakhs.
SARFAESI Act
- SARFAESI Act of 2002 is “.. an act to regulate securitization and reconstruction of financial assets and enforcement of security interests, and to provide for a central database of security interests created on property rights, and for matters associated with or incidental thereto,”.
- SARFAESI is an acronym for Securitisation and Reconstruction of Financial Assets and Enforcement of Security Interest.
- It permits banks and other financial institutions to recover loans by auctioning off the defaulter’s residential or commercial assets.
- Under this act, India’s first Asset Reconstruction Corporation (ARC), ARCIL, was established.
- Secured creditors (banks or financial institutions) have rights to security interest enforcement under section 13 of the SARFAESI Act, 2002.
- The SARFAESI Act of 2002 will now apply to all state and multi-state co-operative banks, according to the Supreme Court of India. Banks can now seize and sell defaulters’ properties to recoup their debts, thanks to the Supreme Court’s momentous decision.
Insolvency and Bankruptcy Code
- The Insolvency and Bankruptcy Code, 2016 (IBC) is India’s bankruptcy law, which aims to unify the existing framework by establishing a single insolvency and bankruptcy law.
- Insolvency is a condition in which a debtor is unable to pay his/her debts.
- Bankruptcy is a legal process that involves an insolvent person or company that is unable to pay its debts.
- It establishes clearer and faster insolvency procedures to assist creditors, such as banks, in recovering debts and avoiding bad loans, which are a major drag on the economy.
- It is an all-encompassing insolvency code that applies to all businesses, partnerships, and individuals (other than financial firms).
Bad Bank
- A bad bank is a financial institution that was formed to purchase the bad loans and other illiquid assets of another financial institution.
- An organisation with a large number of nonperforming assets will sell them to the bad bank at market value.
- The original institution may be able to clear its balance sheet by transferring such assets to the bad bank, albeit it will still be compelled to take write-downs.
- Instead of a single bank, a bad bank structure may assume the risky assets of a consortium of financial organisations.
- Grant Street National Bank is a well-known example of a bad bank. This entity was founded in 1988 to house Mellon Bank’s bad assets.
- Outside of the United States, the Republic of Ireland established the National Asset Management Agency, a bad bank, in 2009 in response to the country’s own financial crisis.
Asset Quality Review
- Inspectors from the Reserve Bank of India (RBI) typically review bank records once a year as part of the Annual Financial Inspection (AFI) process.
- In 2015-16, however, throughout the months of August and November, a special inspection was carried out. Asset Quality Review (AQR) was the name given to this.
- A small sample of loans is evaluated in a routine AFI to see if asset classification matches loan repayment and if banks have made necessary reserves.
- The sample size in the AQR, on the other hand, was substantially larger, and most of the large borrower accounts were investigated to see if categorisation complied with prudential standards.
- According to some reports, a list of over 200 accounts was identified, and banks were instructed to designate them as non-performing.
- Banks were allocated two quarters to complete the asset classification: October-December 2015 and January-March 2016.
- The main aspect of AQR is that it is a random check rather than a periodic check.
Recapitalisation of Banks
- Recapitalisation of Banks is injecting additional capital into state-owned banks to bring them up to capital adequacy standards.
- It entails injecting more capital into state-owned banks in order for them to achieve capital adequacy requirements.
- The requirement for Indian public sector banks to maintain a Capital Adequacy Ratio (CAR) of 12 per cent has been underlined by the Reserve Bank of India in line with BASEL norms.
- The capital-to-risk-weighted-assets-and-current-liabilities ratio (CAR) is the ratio of a bank’s capital to its risk-weighted assets and current liabilities.
- The government injects capital into banks that are short on cash using a variety of instruments.
- Because the government is the largest stakeholder in public sector banks, it is the government’s responsibility to increase capital reserves.
- The government injects capital into banks by issuing bonds or buying new shares.
- In 2017, the government had announced an Rs. 2.11 Lakh crore recapitalisation package for the Public sector Banks
Prompt Corrective Action
- The RBI uses the PCA framework to keep track of banks with poor financial performance.
- The PCA framework was introduced by the RBI in 2002 as a structured early-intervention mechanism for banks that have become undercapitalized or fragile due to a loss of profitability.
- Its goal is to address the issue of non-performing assets (NPAs) in India’s banking system.
- Based on the recommendations of the Financial Stability and Development Council’s working group on Resolution Regimes for Financial Institutions in India and the Financial Sector Legislative Reforms Commission, the framework was reviewed in 2017.
- If a bank is in crisis, PCA is supposed to inform the regulator, as well as investors and depositors.
- The goal is to prevent problems from reaching crisis proportions.
- Essentially, PCA assists RBI in monitoring banks’ key performance indicators and taking corrective action to restore a bank’s financial health.
The global Scenario
The global financial system has been impacted by significant strains since early March 2023 from the banking turmoil in the U.S. and Europe. In contrast, the financial sector in India has been stable and resilient, as reflected in sustained growth in bank credit, low levels of non-performing assets and adequate capital and liquidity buffers,” he said.
RBI said that as per the latest Systemic Risk Survey carried out in May 2023, risk across most categories that contribute to domestic systemic risk receded. However, risk from global spillovers remained in the ‘high’ risk category with more than half of the respondents expressing falling confidence in the stability of the global financial system.
“Tightening of global financial conditions, global growth slowdown and volatility in capital flows were cited as major risks,” it said.
Conclusion
Given the enormous size of the banking industry, there is no doubt that the threat of NPAs must be mitigated. It poses a significant threat to the Indian economy’s macroeconomic stability.
An examination of the current situation reveals that the problem is multifaceted, with roots in the economic slowdown, the deteriorating business climate in India, shortages in the legal system, and the banks’ operational shortcomings. The RBI’s recommendations are a positive step in this direction.
Chapter 19: Fiscal Policy
Introduction
Fiscal policy refers to the use of government spending and tax policies to influence economic conditions, especially macroeconomic conditions. These include aggregate demand for goods and services, employment, inflation, and economic growth.
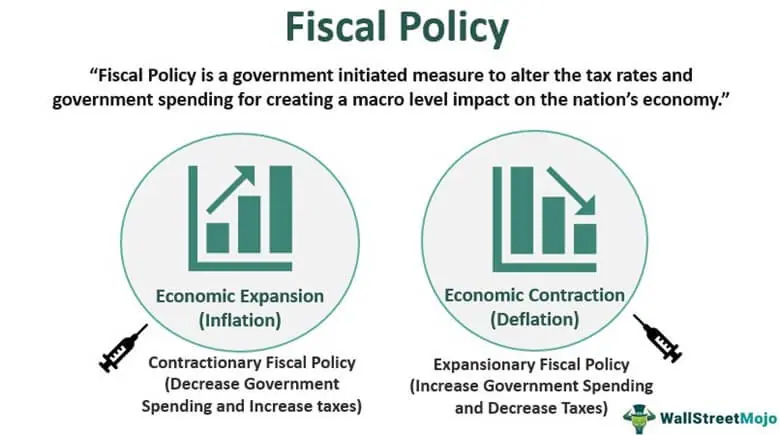
In this Document you will find
- Definition of fiscal policy
- Background
- How does it work?
- Objectives of fiscal policy
- Important terms/concepts related to government revenue and expenditure
- Deficit
- How Does Fiscal Policy Affect People?
- FRBMA Policies
- Conclusion
Definition:
Fiscal policy refers to the use of government spending and tax policies to influence economic conditions, especially macroeconomic conditions. These include aggregate demand for goods and services, employment, inflation, and economic growth.
Background:
Historically, the prominence of fiscal policy as a policy tool has waxed and waned. Before 1930, an approach of limited government, or laissez-faire, prevailed. With the stock market crash and the Great Depression, policymakers pushed for governments to play a more proactive role in the economy.
More recently, countries had scaled back the size and function of government—with markets taking on an enhanced role in the allocation of goods and services—but when the global financial crisis threatened worldwide recession, many countries returned to a more active fiscal policy.
How does fiscal policy work?
- Central banks indirectly target activity by influencing the money supply through adjustments to interest rates, bank reserve requirements, and the purchase and sale of government securities and foreign exchange.
- Governments influence the economy by changing the level and types of taxes, the extent and composition of spending, and the degree and form of borrowing.
- Governments directly and indirectly influence the way resources are used in the economy.
- A basic equation of national income accounting that measures the output of an economy—or gross domestic product (GDP)—according to expenditures helps show how this happens:
GDP = C + I + G + NX.
On the left side is GDP—the value of all final goods and services produced in the economy. On the right side are the sources of aggregate spending or demand—private consumption (C), private investment (I), purchases of goods and services by the government (G), and exports minus imports (net exports, NX).
- Fiscal policy that increases aggregate demand directly through an increase in government spending is typically called expansionary or “loose.”
- By contrast, fiscal policy is often considered contractionary or “tight” if it reduces demand via lower spending.
The government has two variables to influence fiscal policy, namely
- Taxation- regulating which the government increases or decreases the disposable cash in the hands of the public.
- Government spending- using which the government invests in public infrastructural works and other social welfare schemes that directly or indirectly influence the state of the economy.
- During a period of negative growth, the public and investors may lose faith in the economy which in turn may result in lower production and lower demand. To counter that the government may increase spending to tide over the falling private sector investment and to create demand in the market.
OBJECTIVES OF FISCAL POLICY:
- Besides providing goods and services like public safety, highways, or primary education, fiscal policy objectives vary.
- In the short term, governments may focus on macroeconomic stabilization—for example, expanding spending or cutting taxes to stimulate an ailing economy, or slashing spending or raising taxes to combat rising inflation or to help reduce external vulnerabilities.
- In the longer term, the aim may be to foster sustainable growth or reduce poverty with actions on the supply side to improve infrastructure or education.
- Although these objectives are broadly shared across countries, their relative importance differs, depending on country circumstances.
- In the short term, priorities may reflect the business cycle or response to a natural disaster or a spike in global food or fuel prices. In the longer term, the drivers can be development levels, demographics, or natural resource endowments.
IMPORTANT TERMS
RECEIPTS:
Receipts The receipts of government show the different sources from which government raises revenue. These receipts are of two kinds:
- Revenue receipts and
- Capital receipts.
Revenue Receipt
- Revenue receipts are current income receipts from all sources such as taxes, profits of public enterprises, grants, etc.
- Revenue receipts neither create any liability nor cause any reduction in the assets of the government.
- Revenue Receipts are current incomes of government, which neither create liabilities nor cause any reduction in the assets of the government.
- These receipts are classified into
- Tax Revenue and
- Non-tax Revenue.
Tax Revenue:
- A tax is a legal compulsory payment by the people and firms to the government of a country without reference to any direct benefit in return. It is imposed on the people by the government.
- A government collects revenue from various taxes like income tax, sales tax, service tax, excise duty, custom duty etc.
- Traditionally the revenue from taxes has been the primary source of government income. Income tax is imposed on those who earn income such as wages, salaries, rent, interest and profit. Sales tax is the tax on the sale of goods.
- Whenever we purchase a good, a part of our payment goes to the government as sales tax.
- Service tax is the tax we pay when we use a service such as telephone service. Excise duty is a tax paid by the producer manufacturing a good. Custom duty is paid when a good is imported or exported.
Non-Tax Revenue:
The incomes accruing to government from sources other than taxes are non-tax revenues. The major sources of non-tax revenues of the central government of India are:
(i) Commercial Revenue: It is received by government in the form of prices paid by people for goods and services that government provides e.g., people pay for electricity and for services of Railways, postal stamps, toll etc.
(ii) Administrative Revenue: It arises on account of administrative services of the government. They are as follow:
- fees in the form of passport fees, government hospital fees, education fees, court fee, etc.
- fine and penalties: charged by government on law-breakers for disobeying rules and regulations.
- licence fee and permit
- Escheat: Income that government get by taking possession of property which has no legal claimant or legal heir.
- Interest receipts
- profits of public sector undertakings.
Capital receipts
Capital receipts, on the other hand, are the receipts of the government which either create liability or cause any reduction in the assets of the government. e.g., borrowings, recovery of loan and disinvestment etc.
Capital Receipts are those receipts of the government which either create liability or cause any reduction in the assets of the government.
The major sources of capital receipts of the central government are:
Borrowings: There are two sources from which the central government borrows.
They are:
Domestic Borrowings: The government borrows from domestic financial market by issuing securities and treasury bills. It also borrows from people through various deposit schemes such as Public Provident Fund, Small Savings Schemes, and National Savings Scheme etc. These are borrowings of the government within the country.
External Borrowings: In addition to domestic borrowings the government also borrows from foreign governments and international bodies like International Monetary Fund (IMF), World Bank etc. Foreign borrowings by the government bring in foreign exchange into the domestic economy.
Recovery of Loans: Quite often state and local governments borrow from the central government. The loans recovered by the central government from state and local governments are capital receipts in the budget because recovery of loans reduces debtors (assets).
Disinvestment – Resale of shares of public sector undertakings: This is a very recent source of capital receipts by which the central government has been mobilizing financial resources since 1991.
Prior to 1991, the central government owned 100 percent of the shares of public sector undertakings.
From 1991, the government adopted the policy of privatisation of public sector undertakings. Consequently, it started selling its shares to general public and to financial institutions.
This selling of shares of public sector undertakings by the government is known as ‘disinvestment of public sector undertakings.
EXPENDITURE:
Government expenditure is classified in two ways: capital expenditure and revenue expenditure.
When government incurs expenditure to create assets such as school and hospital buildings, roads bridges, canals, railway lines etc., or reduce its liability such as repayment of loan etc., such expenditure is known as capital expenditure.
But when government incurs expenditure that neither creates any asset nor reduces any liability, such expenditure is known as revenue expenditure. For Example, payment of salaries to government employees, maintenance of public property, providing free education and health services to people, etc constitute revenue expenditure. These do not create any public asset
DEFICIT:
- In simple terms, a deficit means an amount by which a sum falls short of some reference amount.
- A deficit is an amount by which one resource, especially money, falls short of what is required.
- If expenditures exceed income, imports exceed exports, or liabilities exceed assets, a deficit exists.
- A deficiency or loss is synonymous with a deficit, and it is the opposite of a surplus.
- The cumulative negative amounts in a deficit are higher than the total positive amounts. In other words, money outflows exceed fund inflows. A deficit can occur when a government, corporation, or person spends more than earned in a given period, which is usually a year.
TYPES OF DEFICIT IN INDIA
The following are the various types of deficits and the way to arrive at them.
- Budget deficit: Total expenditure as reduced by total receipts
- Revenue deficit: Revenue expenditure as reduced by revenue receipts.
- Fiscal Deficit: Total expenditure as reduced by total receipts except borrowings.
- Primary Deficit: Fiscal deficit as reduced by interest payments.
- Effective Revenue Deficit: Revenue deficit as reduced by grants for the creation of capital assets.
- Monetized Fiscal Deficit: The part of the fiscal deficit which is covered by the borrowing from the RBI.
HOW DOES FISCAL POLICY AFFECT PEOPLE?
- Often, the effects of fiscal policy aren’t felt equally by everyone.
- Depending on the political orientations and goals of the policymakers, a tax cut could affect only the middle class, which is typically the largest economic group.
- In times of economic decline and rising taxation, this same group may have to pay more taxes than the wealthier upper class.
- Similarly, when a government decides to adjust its spending, its policy may affect only a specific group of people.
- A decision to build a new bridge, for example, will give work and more income to hundreds of construction workers.
- A decision to spend money on building a new space shuttle, on the other hand, benefits only a small, specialized pool of experts and firms, which would not do much to increase aggregate employment levels.
FRBM POLICY
Why was the FRBM Act passed?
The primary objective was the elimination of revenue deficit and bringing down the fiscal deficit.
- The other objectives included:
- Introduction of a transparent system of fiscal management within the country
- Ensuring equitable distribution of debt over the years
- Ensuring fiscal stability in the long run
- The act also intended to give the required flexibility to the Central Bank for managing inflation in India.

Features of the FRBM Act
- It was mandated by the act that the following must be placed along with the Budget documents annually in the Parliament:
- Macroeconomic Framework Statement
- Medium Term Fiscal Policy Statement and
- Fiscal Policy Strategy Statement
- It was proposed that the four fiscal indicators i.e, revenue deficit as a percentage of GDP, fiscal deficit as a percentage of GDP, tax revenue as a percentage of GDP, and total outstanding liabilities as a percentage of GDP be projected in the medium-term fiscal policy statement.
- Targets and Fiscal Indicators as per the FRBM Act
- As per the latest target of the FRBM Act:
Government is required to limit the fiscal deficit to 3% of the GDP by March 31, 2021.
Government is required to limit debt of the central government to 40% of the GDP by the year 2024-25.
CONCLUSION:
- Fiscal policy is directed by the U.S. government with the goal of maintaining a healthy economy.
- The tools used to promote beneficial economic activity are adjustments to tax rates and government spending.
- When economic activity slows or deteriorates, the government may try to improve it by reducing taxes or increasing its spending on various government programs.
- When the economy is overly active and inflation threatens, it may increase taxes or reduce spending.
- However, neither is palatable to politicians seeking to stay in office. Thus, at such times, the government looks to the Fed to take monetary policy action to reduce inflation.
Chapter 20: Balance Of Payment
BALANCE OF PAYMENT
- Definition
- Example
- Why BOP is important for a Country?
- What is a Balance of Payment Deficit?
- What is a Balance of Payment Surplus?
- Purposes of BoP Calculation
- Components of Balance of Payment (BOP)
- India’s Balance of Payments Status
- Conclusion
DEFINITION:
The balance of payments (BOP) is the method countries use to monitor all international monetary transactions in a specific period.
The BOP is usually calculated every quarter and every calendar year.
All trades conducted by both the private and public sectors are accounted for in the BOP to determine how much money is going in and out of a country.
If a country has received money, this is known as a credit, and if a country has paid or given money, the transaction is counted as a debit.
RBI is responsible for preparing BOP and it shall be consistent with the BOP manual of International Monetary Fund (IMF).
(Money flowing in the country is taken as + and money going out of the country is taken as negative). For example, when India exports something it earns foreign currency and is taken as positive in BOP record and when India imports something, we need to pay in foreign currency and money goes out of the country and is taken as negative.
A country has to deal with other countries in respect of the following
- Visible items which include all types of physical goods exported and imported.
- Invisible items which include all those services whose export and import are not visible. e.g. transport services, medical services etc.
- Capital transfers which are concerned with capital receipts and capital payment
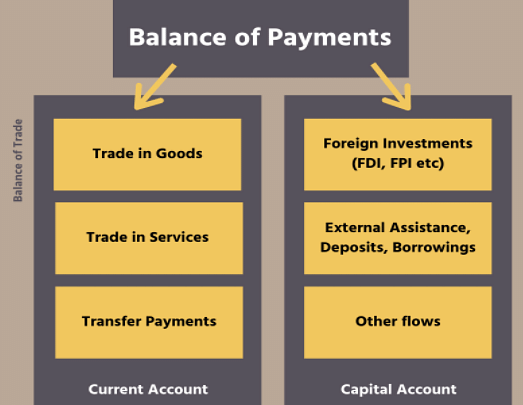
EXAMPLE FOR BOP?
Funds entering a country from a foreign source are booked as credit and recorded in the BOP. Outflows from a country are recorded as debits in the BOP. For example, say Japan exports 100 cars to the U.S. Japan books the export of the 100 cars as a debit in the BOP, while the U.S. books the imports as a credit in the BOP.
COMPONENENTS OF BOP?
The BOP is divided into three main categories:
- The current account (which includes a goods and services account, a primary income account, and a secondary income account),
- The capital account,
- The financial account.
Within these three categories are subdivisions, each of which accounts for a different type of international monetary transaction

The Current Account
- The current account is used to mark the inflow and outflow of goods and services into a country. Earnings on investments, both public and private, are also put into the current account.
- Within the current account are credits and debits on the trade of merchandise, which includes goods such as raw materials and manufactured goods that are bought, sold, or given away (possibly in the form of aid).
- Services refer to receipts from tourism, transportation (such as the levy that must be paid in Egypt when a ship passes through the Suez Canal), engineering, business service fees (from lawyers or management consulting, for example)
- Goods and services together make up a country’s balance of trade (BOT). The BOT is typically the biggest bulk of a country’s balance of payments, as it makes up total imports and exports.
- If a country has a BOT deficit, it imports more than it exports, and if it has a BOT surplus, it exports more than it imports.
- Receipts from income-generating assets such as stocks (in the form of dividends) are also recorded in the current account.
- The last component of the current account is unilateral transfers. These are credits that are mostly workers’ remittances, which are salaries sent back into the home country of a national working abroad, as well as foreign aid that is directly received.
Goods (DEFICIT)- Imports and exports of goods like crude oil, gold (Imports) and exports of cotton, spices etc
Services (SURPLUS)- include transportation, financial services, travel, telecommunications, computer services and professional services.
Income (DEFICIT) receipts are the income earned (as profits, interest and dividends) from the ownership of overseas assets by Indian companies, government and individuals
Transfers (SURPLUS) include remittances from Indians working abroad.
The Capital Account
- The capital account is where all international capital transfers are recorded.
- This refers to the acquisition or disposal of nonfinancial assets (for example, a physical asset such as land) and non-produced assets, which are needed for production but have not been produced, such as a mine used for the extraction of diamonds.
- The capital account is broken down into the monetary flows branching from debt forgiveness, the transfer of goods, and financial assets by migrants leaving or entering a country, the transfer of ownership on fixed assets (assets such as equipment used in the production process to generate income),
- The transfer of funds received to the sale or acquisition of fixed assets, gift and inheritance taxes, death levies, and, finally, uninsured damage to fixed assets.
The Financial Account
In the financial account, international monetary flows related to investment in business, real estate, bonds, and stocks are documented.
Also included are government-owned assets, such as foreign reserves, gold, special drawing rights (SDRs) held with the International Monetary Fund (IMF), private assets held abroad, and direct foreign investment. Assets owned by foreigners, private and official, are also recorded in the financial account.
WHY BOP IS IMPORTANT FOR A COUTRY?
A country’s BOP is vital for the following reasons:
- The BOP of a country reveals its financial and economic status.
- A BOP statement can be used to determine whether the country’s currency value is appreciating or depreciating.
- The BOP statement helps the government to decide on fiscal and trade policies.
- It provides important information to analyse and understand the economic dealings with other countries.
- By studying its BOP statement and its components closely, one would be able to identify trends that may be beneficial or harmful to the county’s economy and, thus, then take appropriate measures.
CONCLUSION:
The balance of payments (BOP) is the method by which countries measure all of the international monetary transactions within a certain period.
The BOP consists of three main accounts: the current account, the capital account, and the financial account.
The current account is meant to balance against the sum of the financial and capital account but rarely does.
Globalization in the late 20th century led to BOP liberalization in many emerging market economies. These countries lifted restrictions on BOP accounts to take advantage of the cash flows arriving from developed foreign nations, which in turn boosted their economies.
Chapter 21: Taxation
TAXATION
- Definition of Taxation
- Objectives behind Taxation
- Why do we need to pay taxes?
- Types of taxes
- Progressive, Regressive taxes
- Description of various types of taxes in India
- Major taxation related reforms introduced in recent times
- Trend of tax collection in India
- Issues associated with taxation system in India
- Measures suggested/recommendations made to address issues associated with taxation system in India
DEFINITION:
Taxation, imposition of compulsory levies on individuals or entities by governments. Taxes are levied in almost every country of the world, primarily to raise revenue for government expenditures, although they serve other purposes as well.
OBJECTIVES BEHIND TAXATION:
- During the 19th century the prevalent idea was that taxes should serve mainly to finance the government.
- In earlier times, and again today, governments have utilized taxation for other than merely fiscal purposes.
- One useful way to view the purpose of taxation, attributable to American economist Richard A. Musgrave, is to distinguish between objectives of resource allocation, income redistribution, and economic stability.
- (Economic growth or development and international competitiveness are sometimes listed as separate goals, but they can generally be subsumed under the other three.)
- In the absence of a strong reason for interference, such as the need to reduce pollution, the first objective, resource allocation, is furthered if tax policy does not interfere with market-determined allocations.
- The second objective, income redistribution, is meant to lessen inequalities in the distribution of income and wealth. The objective of stabilization—implemented through tax policy, government expenditure policy, monetary policy, and debt management—is that of maintaining high employment and price stability.
WHY DO WE NEED TO PAY TAXES?
- There is an old saying that goes “the only sure things in life are death and taxes.” Taxation has been a feature of society going back to ancient times.
- The role of taxes is to help governments fund various undertakings such as public works, infrastructure, and wars.
- Today, taxpayer dollars are still used for a variety of similar purposes.
TYPES OF TAXES:
Direct Tax
- The definition of direct tax is hidden in its name which implies that this tax is paid directly to the government by the taxpayer
- The general examples of this type of tax in India are Income Tax and Wealth Tax.
- From the government’s perspective, estimating tax earnings from direct taxes is relatively easy as it bears a direct correlation to the income or wealth of the registered taxpayers.
Indirect Tax
- Indirect taxes are slightly different from direct taxes and the collection method is also a bit different. These taxes are consumption-based that are applied to goods or services when they are bought and sold.
- The indirect tax payment is received by the government from the seller of goods/services.
- The seller, in turn, passes the tax on to the end-user i.e. buyer of the good/service.
- Thus, the name indirect tax as the end-user of the good/service does not pay the tax directly to the government.
- Some general examples of indirect tax include sales tax, Goods and Services Tax (GST), Value Added Tax (VAT), etc.
PROPORTIONAL, PROGRESSIVE, REGRESSIVE TAXES:
Taxes can be distinguished by the effect they have on the distribution of income and wealth.
- A proportional tax is one that imposes the same relative burden on all taxpayers—i.e., where tax liability and income grow in equal proportion.
- A progressive tax is characterized by a more than proportional rise in the tax liability relative to the increase in income, and a regressive tax is characterized by a less than proportional rise in the relative burden.
- Thus, progressive taxes are seen as reducing inequalities in income distribution, whereas regressive taxes can have the effect of increasing these inequalities.
- The taxes that are generally considered progressive include individual income taxes and estate taxes.
- Income taxes that are nominally progressive, however, may become less so in the upper-income categories—especially if a taxpayer is allowed to reduce his tax base by declaring deductions or by excluding certain income components from his taxable income.
- Proportional tax rates that are applied to lower-income categories will also be more progressive if personal exemptions are declared.
- Sales taxes and excises (except those on luxuries) tend to be regressive, because the share of personal income consumed or spent on a specific good decline as the level of personal income rises.
- Poll taxes (also known as head taxes), levied as a fixed amount per capita, obviously are regressive.
VARIOUS TYPES OF TAXES IN INDIA:
What are the Different Types of Direct Tax?
Direct taxes account for almost 50% of the government’s revenue in India. However, income tax is not the only direct tax. Here are the types of direct taxes applicable in India:
- Income Tax
- Capital Gains Tax
- Corporate Tax
- Income tax applies to any income of an Individual and HUF except capital gains and profits from business and profession. Income tax is calculated as per the applicable slab rates for the Assessment Year.
- The central government announces the slab rates in the annual budget.
- You also have the provision to reduce your taxable income using the tax-saving investments and expenses under section 80C.
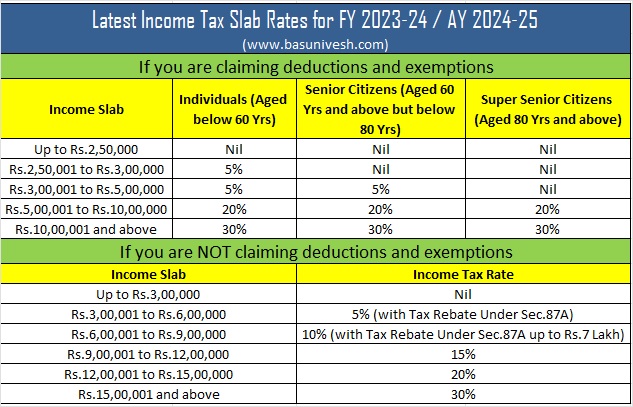
What other Taxes come under Direct Tax?
Individuals in India, earn an income in a diverse range. Therefore, it is important to levy a tax on you based on your income and if someone earns more, the tax percentage should be different. The Income Tax Act segregates the income range and charges different rates as per the segregation. The different groups are known as tax slabs. Your income tax slab can vary not only based on your income but also your age. Every year during the Central Government’s Budget Session, amendments are made in the income-tax slabs.
-
Capital Gains Tax
Capital gains tax apply to the profits from the sale of a capital asset only. The rate of tax on capital gains depends on the type of capital gain. Income Tax Act, 1961 divides the capital gains tax into the following two types:
- Short-Term Capital Gains Tax
- Long-Term Capital Gains Tax
Short-term capital gains are when the assets are sold within a specified period, for example:
- Equity stocks sold within 12 months of purchase
- Debt mutual fund units sold within 36 months of purchase
- Real estate property or gold sold within 36 months of purchase
If the asset is sold after the specified period, the gains or losses will become long-term capital gain or loss.
Depending on the type of asset your gain may receive indexation benefit on long-term capital gains. Indexation allows you the benefit of inflation to your capital gains, reducing your tax liability.
-
Corporate Tax
The corporate tax applies to the businesses and entities filing their returns as a company. This is also a slab rate depending on the turnover of the firm.
|
Income* |
Turnover less than or equal to Rs 4 billion in FY 2018/19 |
For other domestic companies |
Foreign companies |
|
|||
|
Base Rate |
Effective# |
Base Rate |
Effective# |
Base Rate |
Effective# |
||
|
Less than Rs 1 crore |
25 |
26 |
30 |
31.2 |
40 |
41.6 |
|
|
More than Rs 1 crore but less than Rs 10 crore |
25 |
27.82 |
30 |
33.38 |
40 |
42.43 |
|
|
More than Rs 10 crore |
25 |
29.12 |
30 |
34.94 |
40 |
43.68 |
|
Surcharge of 10% if income exceeds Rs 1 crore
# Health & Education Cess of 4% as of FY 2020-21
What are the Different Types of Indirect Taxes in India?
Indirect taxes in India have been the most consistent and largest revenue source for the government. The Indian tax system has had multiple indirect taxes, some of these are still operational:
- Service Tax
- Indian Excise Duty
- Value Added Tax (VAT)
- Customs Duty
- Securities Transaction Tax (STT)
- Stamp Duty
- Entertainment Tax
- Few of the indirect taxes in India like service tax, value-added tax and excise duty have been removed for a large number of goods and services. These taxes have been replaced by a single Goods and Services Tax.
- Customs duty tax applies to the goods being imported into India from other countries, and in a few cases on the goods being exported from India.
- Securities Transaction Tax or STT applies to the transactions involving an exchange of financial securities. For example, equity stocks, mutual fund units, future and options contracts. This tax is necessarily applied to securities exchange transactions. However, you can also pay Stamp duty and STT on securities changing hands outside the exchange or over the counter.
- STT allows the buyers and sellers of securities to benefit from lower short and long-term capital gains taxes on the exchange.
- Stamp duty is a State Government levy on the transfer of assets within their territory. It acts as legal proof of ownership of the asset or security.
- Entertainment tax in India is also a state subject and applies to the transactions involving the entertainment business in the country. Such businesses and activities will include movie releases, sporting events, concerts, amusement parks, theatres, etc.
What is Goods and Services Tax?
Goods and Services Tax or GST has been a consolidation of a complex web of indirect taxes in India.
Taxation in India can have three layers of levies – Centre, State and Local Authority or Municipalities.
Before GST introduction in the Indian taxation system, the following indirect taxes could apply to the goods and services in India:
- Excise Duty
- Entertainment Tax
- Value Added Tax (VAT, State)
- Octroi
- Service Tax
- Central Sales Tax (collected by State)
- Purchase Tax
- Entry Tax (State)
- Luxury Tax (State)
These interconnecting and often overlapping taxes posed many disadvantages and conflicts for suppliers and manufacturers along with the government bodies.
Disadvantages of Indirect Taxes before GST
- A complex web of multiple tax points and returns for suppliers
- Incidents of double taxation and cascading effect
- Difficult web legal conditions for exporters
- The difficulty of market entry due to varying rules and regulations
- Very high after-tax prices for goods and services
- The introduction of GST was to remove the complexity and hurdles towards participation in nationwide markets for businesses. For the individuals and end consumers, GST made the goods and services cheaper, while making taxation transparent and easy for sellers.
The Present State of GST
GST has simplified the indirect taxation for goods and services in India. With GST, instead of five or six different taxes you only need to consider the following three (out of which only two will apply):
- Central Goods & Services Tax (CGST)
- State Goods & Services Tax (SGST)
- Integrated Goods & Services Tax (IGST)
CGST and SGST will apply when the sale is happening within the state. IGST applies to the goods being sold between states.
The Rate of GST
GST rates for different commodities and services are announced by the GST council under the Central Board of Indirect Taxes and Customs (CBIC). The average rate of GST in India is about 12%.
Compared to the other countries and economies around the world using GST the rates are on the lower side.
Exemptions on Tax Deduction
- The tax deduction is a reduction of income that eventually lowers your tax liability. Deductions are expenses that you incur during the year and it can be subtracted from your total income in order to calculate how much tax you need to pay.
- There are many deductions that you can use to reduce your total income. Here are some of the most commonly used ways for the tax deduction –
- House Rent Allowance – If you have a rented accommodation, you can get the tax benefit under HRA. The amount exempted can be totally or partially exempted from income tax.
- Medical Insurance Deduction – If you have brought a medical policy, the premium you paid for the policy could save your tax as the amount is deducted from gross income (up to a limit).
- Food Coupons – Some employers may provide you with food coupons such as Sodexo. Such meal coupons are tax-exempt up to a certain limit. The yearly exemption for food coupons is up to Rs 26,400.
- Section 80C, 80CC and 80CCD(1) – This is the most popular option and you must already be using it to reduce your taxes. Under this, you can reduce your taxable income by putting your money in tax saving investments.
TAXATION REFORMS IN INDIA:
Indirect taxes reforms:
The integration of State and Central indirect taxes in the GST led to the abolition of entry tax and the Central Sales Tax (CST).
This has had important spillover effects on the economy. The abolition of the entry tax has reduced trip times on the major road corridors leading to cost benefits for the manufacturers. GST stands for Goods and Services Tax.
It is an Indirect tax which introduced to replace a host of other Indirect taxes such as VAT service tax, purchase tax, excise duty, and so on. GST levied on the supply of certain goods and services in India. It is one tax that is applicable all over India.
Reduction in the corporate tax rate for all existing domestic companies:
In order to promote growth and investment, the Government has brought in a historic tax reform through the Taxation Laws (Amendment) Ordinance 2019 which provided a concessional tax regime of 22% for all existing domestic companies from FY 2019-20 if they do not avail any specified exemption or incentive. Further, such companies have also been exempted from payment of Minimum Alternate Tax (MAT).
The incentive for new manufacturing domestic companies: In order to attract investment in the manufacturing sector, the Taxation Laws (Amendment) Ordinance 2019 has drastically reduced the tax rate to 15% for new manufacturing domestic companies if such company does not avail any specified exemption or incentive. These companies have also been exempted from payment of Minimum Alternate Tax (MAT).
Reduction in MAT rate: In order to provide relief to the companies which continue to avail exemption/deduction and pay tax under MAT, the rate of MAT has also been reduced from 18.5% to 15%.
The Government is committed to providing a hassle-free direct tax environment with moderate tax rates and ease of compliance to the taxpayers and also to stimulate growth by reforming the direct taxes system. Some of the recent steps taken in this direction, apart from those discussed above, are as under:
Personal Income Tax –In order to reform Personal Income Tax, the Finance Act, 2020 has provided an option to individuals and co-operatives for paying income tax at concessional rates if they do not avail of specified exemption and incentive.
Abolition of Dividend Distribution Tax (DDT) – In order to increase the attractiveness of the Indian Equity Market and to provide relief to a large class of investors in whose case dividend income is taxable at the rate lower than the rate of DDT, the Finance Act, 2020 removed the Dividend Distribution Tax under which the companies are not required to pay DDT with effect from 01.04.2020. The dividend income shall be taxed only in the hands of the recipients at their applicable rate.
Vivad se Vishwas – In the current times, a large number of disputes related to direct taxes are pending at various levels of adjudication from Commissioner (Appeals) level to Supreme Court.
These tax disputes consume a large part of resources both on the part of the Government as well as taxpayers and also deprive the Government of the timely collection of revenue.
With these facts in mind, an urgent need was felt to provide for the resolution of pending tax disputes which will not only benefit the Government by generating timely revenue but also the taxpayers as it will bring down mounting litigation costs and efforts can be better utilized for expanding business activities.
Direct Tax Vivad se Vishwas Act, 2020 was enacted on 17th March 2020 under which the declarations for settling disputes are currently being filed.
Faceless E-assessment Scheme – The E-assessment Scheme, 2019 has been notified on 12th September 2019 which provides for a new scheme for making assessments by eliminating the interface between the Assessing Officer and the assessee, optimizing the use of resources through functional specialization, and introducing the team-based assessment.
Faceless appeals –In order to take the reforms to the next level and to eliminate human interface, the Finance Act, 2020 empowered the Central Government to notify the Faceless Appeal Scheme in the appellate function of the department between the appellant and the Commissioner of Income-tax (Appeals).
ISSUES WITH INDIA’S TAX SYSTEM
Retrospective tax: The policy of retrospective taxation has acted as an “irritant” and adversely affected the inflow of foreign capital to India.
Abrupt Policy Changes: There has been a lack of certainty about tariff and taxes. This uncertainty needs to be resolved soon to boost business and investments ties.
Plethora of Taxation Laws: There have been many taxation laws of the Central and many State Governments which increases complexities and litigation and reduces predictability, fairness and automation.
MEASURES TO ADRESS TAX RELATED ISSUES:
- Check on exemptions like transfer pricing, base erosion and profit shifting (BEPS), etc
- Widening of the individual tax payers’ base as suggested by Economic survey.
- Implementing the recommendations of the Tax Administration Reform Commission (TARC) to merge CBDT and CBEC.
- Use of PAN, simple laws among others to increase tax buoyancy.
- Attitudinal change in citizens by invoking a sense of duty towards the nation.
- The benefits of Information and Communication Technology (ICT) systems have to be reaped.
- Need for effective dispute settlement mechanism
- Create a special task force to track economic activities that are predominantly settled in cash thus bringing the parallel economy under the tax net
- Monitoring jewelry stores to find people who bought gold without paying taxes
- Political efforts to bring India’s informal sector into the formal sector, leveling the playing field, and increasing total wealth
- Reduce tax rate as India has one of the highest tax rates in the world and thereby preventing tax evasion.
- Focus on widening tax base rather than deepening it
- Simplification of direct tax laws as suggested by the Justice Easwar committee must be looked into. “In the long run, if India is to stay “on the line” as its per capita income grows, it will need to build fiscal capacity,” the Survey said.
- Economic survey has suggested taxing the farm sector.
Conclusion: Nobel-winning economist Joseph Stiglitz summarizes that the optimal tax system would be “progressive income taxes, complemented by indirect taxation, property taxes and capital taxes that enhance the progressivity that can be achieved by the tax system while limiting the level of distortion. India must work towards achieving this ideal.
Chapter 22 :Resources Mobilization
MOBILIZATION OF RESOURCES:
- Mobilization of resources is the process of bringing together all the resources required to achieve a particular goal or objective. The resources can be financial, human, natural, or technological.
- Mobilizing resources is critical for the success of any project or initiative. The process involves identifying the resources needed, allocating them effectively and efficiently, and managing them appropriately to ensure they are used in the most effective way.
- In today’s fast-paced world, mobilization of resources has become increasingly important. Organizations, both public and private, are constantly trying to optimize their resources to achieve their goals. With limited resources available, it is essential to mobilize them efficiently.

IMPORTANCE OF RESOURCE MOBILIZATION
- Efficient use of resources: Resource mobilization ensures that resources are allocated efficiently, used effectively, and monitored regularly to ensure maximum output. It ensures that the resources available are used to their full potential, reducing wastage and improving productivity.
- Financial sustainability: Mobilization of financial resources ensures the financial sustainability of an organization or project. Adequate funding is required for research, development, production, and marketing activities. Without proper funding, an organization or project may struggle to achieve its goals and may even fail.
- Human capital development: Mobilizing human resources is essential for developing the skills and capabilities of employees. By investing in training and development programs, an organization can build a highly skilled and motivated workforce that can contribute to its growth and success.
- Innovation and creativity: Mobilizing technological resources enables an organization to leverage new technologies and processes to improve efficiency, reduce costs, and increase competitiveness. This can lead to innovation and creativity, which can drive growth and success.
- Partnerships and collaborations: Resource mobilization also involves building partnerships and collaborations with external stakeholders. These partnerships can help to leverage resources and create synergies that would not be possible otherwise. It also allows organizations to tap into the expertise and knowledge of other organizations and individuals, leading to better decision-making and improved outcomes.
- Resilience and adaptability: Resource mobilization also enables organizations to adapt to changes in their environment. By mobilizing resources effectively, organizations can respond to unexpected challenges and opportunities, improving their resilience and adaptability.

TYPES OF RESOURCES:
There are several types of resources that are essential for economic and social development. Some of the major types of resources:
- Natural resources: Natural resources refer to materials and substances that occur naturally in the environment and are used by humans to sustain life and create wealth. Examples of natural resources include minerals, water, forests, oil, gas, and agricultural land.
- Human resources: Human resources are the people who work in organizations, businesses, and other entities. Human resources can be classified into two main categories: skilled and unskilled. Skilled human resources are those who have specialized knowledge and expertise in a particular field, such as doctors, engineers, and lawyers, while unskilled human resources are those who do not have specialized knowledge or training, such as manual laborers.
- Financial resources: Financial resources refer to money and other forms of capital that are used to finance economic activities. Examples of financial resources include cash, credit, loans, and investments.
- Physical resources: Physical resources refer to tangible objects and equipment that are used in production and other economic activities. Examples of physical resources include machinery, vehicles, buildings, and raw materials.
- Intellectual resources: Intellectual resources refer to intangible assets that are used to create and maintain competitive advantage. Examples of intellectual resources include patents, copyrights, trademarks, and trade secrets.
- Technological resources: Technological resources refer to tools, equipment, and processes that are used to create, develop, and implement new products and services. Examples of technological resources include computers, software, communication systems, and research and development facilities.
MOBILIZATION OF NATURAL RESOURCES:
- India, though a country with sufficient reserves, due to policy bottlenecks, is importing coal and iron. This is increasing our Current Account Deficit.
- India is also facing technological obstacles to exploit some of its the natural resources.
- India is also suffering from the domestic factors like political factors, resistance from tribal people to development and exploitation of resources, inter-state conflicts, disputes with neighboring countries, etc.
MOBILIZATION OF HUMAN RESOURCES:
- Organizing human potential for ready use is necessary for growth of India. In-fact, as country of 125 crore people, India now is eyeing more on its human resource potential. The demographic dividend is also in Favour of India.
- Mobilization of human resources highlights the need to empower human resources.
- Weaker sections like women, children, SC, ST, OBC etc. should be brought into mainstream.
- There should be right employment opportunities for human resources, and when there is lack of skill the job demands, there should be skill development programs.
- Utilize the demographic dividend.
- India is currently levering on its technologists – engineers, doctors and scientists.
MOBILIZATION OF FINANCIAL RESOURCES:
- If a country needs to grow, more goods and services should be produced. The production can be done by government sector, private sector or in PPP mode. But for that, the economic resources of a country should be mobilized.
- In India, despite having good savings rate, domestic investment is less. Indians are investing in less productive assets like gold and consumer durable. If India needs to grow, there should be more investments in agriculture, manufacturing or services.
- In India, tax collected is very less. The tax base has to be widened.
- Four factors of production- land, labor, capital and organization – should come together. There should be an atmosphere for growth and investment.
- Organizations do not “spontaneously emerge” but require the mobilization of resources.
- In modern capitalistic society, these resources are more “free flowing” and are easier to mobilize than in more traditional societies. Many factors impact the development of the organization.
- Initial Resource Mix: There are various resource needs in a starting organization (technology, labor, capital, organizational structure, societal support, legitimacy, etc.). But the right mix of resources is not always available.
- The most important resource of an organization is its people.
- More savings and more productive investment.
How does public sector mobilize domestic resources?
- Taxation
- Public revenue generation for investment in social services and infrastructure.
How does private sector mobilize domestic resources?
- The private sector mobilizes the savings of households and firms through financial intermediaries, which allocate these resources to investment in productive activities.
ISSUES WITH MOBILIZATION OF RESOURCES:
Issues with mobilization of resources include all those issues and problems highlighted in – mobilization of natural resources, human resources and financial resources. Some of them are discussed here:
1.Limited Domestic public resources:
It makes least developed countries (LDCs) highly dependent on external resources which limit their policy space and create some dependency. Their economic vulnerability is further exacerbated by indebtedness.
2.Weak Domestic taxation and fiscal policies:
The fiscal discipline is hardly seen in developing countries. They often resort to deficit financing to pursue development.
The taxes are not broad-based and tax evasion is common in developing countries which squeeze out the chances for public expenditure.
3.Lack of National and sub-regional development banks with rural penetration:
Though India is enjoying the presence of big national and international banks but the financial inclusion at rural level has been a myth.
Moreover, 2008 financial crisis brought national development banks back onto the policy agenda, as countries sought sources of long-term financing to stimulate economic recoveries, and there is greater international acceptance of such banks.
However, poorer and smaller developing countries may face greater obstacles in setting up such banks, due to funding and technical constraints.
4.Illicit financial flows from developing countries:
Illicit financial flows involve resources that have been obtained, transferred or used illegally or illicitly.
A common concern with regard to illicit financial flows from developing countries is the identification of flows considered potentially damaging to economic development.
In developing economies, vital development resources are being lost because of the ease with which capital flight can flourish in the context of a burgeoning yet opaque international financial system [and] closely related to this is the idea that illicit capital flows from developing economies are indicative of deeper structural problems of political governance in these countries.
Concerns over illicit financial flows therefore reflect a range of relevant policy concerns, yet underlying analytical frameworks and empirical methodologies continue to be the subject of debate. Illicit financial flows need not be illegal if relevant legal frameworks do not adequately reflect wider public social and economic interests or do not cover such flows.
5.International tax cooperation:
The combating of illicit financial flows has been a core driver of international tax cooperation in recent years.
In general, international tax cooperation assumes particular importance in a world of hyper globalization, in which tax systems in some countries can affect public revenue collection in other countries.
Such cross-national effects can result from tax evasion, for example if high net worth individuals place financial assets in tax havens, as well as from illicit financial flows arising from the creative accounting or transfer pricing practices of multinational enterprises.
6.Lack of Multilateral development Banks:
Financing needs to support the achievement of the Sustainable Development Goals are considerable.
Lack of financing is not due to a shortfall in global savings; at the global level, institutional investors currently have assets under their management totaling $115 trillion. Most are in the form of developed country securities and other assets that offer low returns.
Multilateral development banks and other international banks, existing and new, are therefore needed to bridge finance from end-savers to development projects. Development banks can thus be key players in development by providing long-term financing directly from their funding sources, by tapping into new sources and by leveraging additional resources, including private, through the co-financing of projects with other partners.
WHY DRM PARTICULARLY IMPORTANT:
- In low-income countries confronting widespread poverty, mobilizing domestic resources is particularly challenging, which has led developing countries to rely on foreign aid, foreign direct investment, export earnings and other external resources. Nevertheless, there are compelling reasons to give much more emphasis to DRM.
- Greater reliance on DRM is vital to elevating economic growth, accelerating poverty reduction and underpinning sustained development.
- High-growth economies typically save 20-30 per cent or more of their income in order to finance public and private investment.
- DRM is potentially more congruent with domestic ownership than external resources.
- Foreign aid invariably carries restrictions and conditionality.
- FDI is primarily oriented to the commercial objectives of the investor, not the principal development priorities of the host country.
- DRM is more predictable and less volatile than aid, export earnings, or FDI.
CONCLUSION
Resource in the form of investment is the most important factor affecting growth. Hence, resource mobilization to boost investment has always been a priority.
The task of mobilizing resources involves deliberate decisions on selection of major investments, control of expenditures, monitoring of performance and realization of planned level of economic activity. Going further, it also includes prevention of tax evasion and tax avoidance.
Chapter 23:Inclusive Growth
Meaning of Inclusive Growth
Inclusive growth refers to a form of economic growth that benefits all segments of society, particularly the marginalized and vulnerable groups, by ensuring that the benefits of development are shared equitably.
“Inclusive Growth” is one of the important components of Amrit Kaal Vision as mentioned in 2023-24 budget. Poverty Reduction, equal distribution of Income, agricultural development, rural economy, and reduction in regional disparities are some examples of inclusive growth.
What exactly is Inclusive Growth?
- Inclusive growth is defined as economic growth that generates employment opportunities and helps in poverty reduction.
- The United Nations Development Program (UNDP) defines Inclusive Growth as “the process and result of all groups of people participating in the organization of growth and benefiting equally from it.”
- It goes beyond measuring economic progress solely through indicators like Gross Domestic Product (GDP) and focuses on creating opportunities, reducing inequalities, and improving the well-being of all citizens.
- Inclusive growth aims to address social disparities, reduce poverty, and promote sustainable development that leaves no one behind.
- Inclusive growth thus involves a fair distribution of resources with benefits reaped by all segments of society.
- But when allocating resources, consideration must be given to the planned short- and long-term advantages for society, such as the accessibility of consumer products, the employment of people, the standard of living, etc.
- It entails ensuring equitable opportunity for everybody, as well as empowering people via education and skill development.
- It also includes a method of growth that is environmentally sustainable, aspires to good governance, and aids in the creation of a gender-conscious society.
- According to the OECD (Organization for Economic Co-operation and Development), inclusive growth is defined as economic growth that is evenly dispersed across society and generates opportunity for everyone.
Features of Inclusive Growth
1.Equality
- Equality of opportunity in terms of access to markets, resources, and unbiased regulatory environment
- To realize the IG in its ultimate form, equality is the most fundamental criteria.
- IG and equality are mutually reinforcing. Without equality, IG can’t be achieved, and lack of IG may lead to in-equality in real or perceived forms.
- In contemporary economic environment, gender equality has become a basic element of IG.
- An OECD report has identified that inequality in India has been continuously rising which has posed policy challenges in promotion of inclusiveness.
2.Good Governance
- Governance means the regulatory or the monitoring process which facilitates the delivery of the government services.
- Good governance results in effectiveness and efficiency, it upholds justice in the rule of law, and accountabilityand it encourages popular participation, consensus, and equality
- Good governance is an integrated effortof state, civil society and citizens
- Good governance is the core of essential public services
- Good governance provides a common platform for all actors and adapts to sustain the socio-economic transformation which is a pre-requisite of IG.
- Private governance highlights the role of private sector in meeting the demand of capital, resource and skills required for IG.
3.Decentralization
- Empowering local self-governing institutions is one of the delivery mechanisms of the IG
- 73rd and 74th amendmentsof the constitutions are innovation in the field of Indian Polity
- The eleventh plan has devised a Devolution Indexto be called PRI-Empowerment Index to empower the PRIs
- Therefore, govt. has to devolve, delegate and decentralizethe administration.
- Decentralization is a bottom-up approach
- The following are the deficiencies in decentralization that limit the IG potential:
- Lack of finance, proper institutions and delegation of roles and responsibilities.
- Divergence in central and state approachesin programs and welfare schemes.
- Incoherencein organization at national and state level.
- Poor accountability, transparency and monitoring mechanism.
4.Accountability and Transparency
- Accountability is answerability towards performance of service delivery
- Accountability is specified both in vertically and horizontally.
- The former refers to the departmental hierarchy in a govt. institution and the latter refers to the autonomous agencies for check and balances on govt. activities e.g. CAG, PMO etc.
- Transparency is necessary for efficient delivery of essential public services; it acts as an enabler for citizensin accessing information on demand which helps them in reinstating their claims on government endowments and entitlements meant for them
- Citizen Charter, Right To Information, Central Vigilance Commissionare revolutionary efforts in achieving accountability and transparency.
5.Sustainability
- Sustainability and IG can’t be achieved in isolation and they supplement each other.
- Sustainability is required at the following levels when charting out the policy framework for IG:
- Financial Sustainability: The IG programs and projects of the govt. should be financially viable. It may be noticed that excess of subsidy and lack of outcome orientationis causing a problem of increasing fiscal deficit.
- Social Sustainability: Social sustainability means the need to maintain and sustain specific structure and culture. This type of problem is typically prevalent in tribal areaswhere the development programs for economic growth come in conflict with the cultural sentiments of the tribal population.
- Environment Sustainability: In long-term, the environment standards must not be jeopardized while in pursuit of IG. By excess use of fertilize, it has lead to unique problem of depletion of soil productivity and technology fatigue.
Elements of Inclusive growth:
Rapid growth and poverty reduction –
- A decisive reduction in poverty and an expansion in economic opportunities for all sections of the population
- Rapid growth is essential for this which results in increase in employment and incomes for large numbers of our people.
- Growth should be balanced to rapidly create jobs in the industrial and services sectors
- Also, a significant portion of the labour force should shift out of agriculture which is currently in low productivity
- efforts to improve the income-earning opportunities of those who remain in agriculture by raising land productivity
- targeted livelihood support programmes aimed at increasing productivity and incomes of the poor in several low income occupations
- Special programmes aimed at target groups such as small and micro enterprises, weavers, artisans, craftsmen, etc
Employment opportunities–
- generate an adequate number of productive employment opportunities
- India is currently at a stage of ‘demographic transition’ where population growth is slowing down but the population of young people entering the labour force continues to expand
- If the workforce is gainfully employed, a lower dependency ratio means a higher rate of savings which, in turn, can raise the growth rate.
- This young demographic profile places India favourably in terms of manpower availability and could be a major advantage in an environment where investment is expanding in India and the industrial world is ageing.
- It is essential to generate employment to both new entrants to the labor force and also for workers leaving agriculture
- Greater labor flexibility is needed which requires some changes in labor laws
- The ability to sustain a labour-intensive growth process depends crucially upon the expansion of skill capabilities in the labour force. Specific programmes for development of skills at all levels is needed.
Access to essential services–
- In the short run, access to basic facilities such as health, education, clean drinking water, etc. impacts directly on welfare
- In longer run, it determines economic opportunities for the future
- Without access to these services one cannot be considered to have equality of opportunity
- Access to these services for the majority of the population depends not only upon their income levels but upon the delivery of these services through publicly funded systems. Therefore, IG also requires major expansion in the supply of these essential services.
Social justice and empowerment–
- Vision of inclusiveness should encompass equality of opportunity, as well as economic and social mobility for all sections of society, with affirmative action for SCs, STs, OBCs, minorities and women
- There should be freedom and dignity, and without social or political obstacles
- This must be accompanied by an improvement in the opportunities for economic and social advancement
- It can be ensured only if there is a degree of empowerment that creates a true feeling of participation so necessary in a democratic polity. Empowerment of disadvantaged and hitherto marginalized groups is therefore an essential part of any vision of inclusive growth.
- India’s democratic polity, with the establishment of the third layer of democracy at the Panchayati Raj Institution (PRI) level, provides opportunities for empowerment and participation of all groups with reservations for SCs, STs, and women. These institutions should be made more effective through greater delegation of power and responsibility to the local level.
Environment Sustainability–
- clear commitment to pursue a development process which is environmentally sustainable
- based on a strategy that not only preserves and maintains natural resources, but also provides equitable access to those who do not have such access at present.
- Unless environment protection is brought to the centre stage of policy formulation, what is perceived as development may actually lead to a deteriorating quality of life
- an effective strategy requires international co-operation to evolve forms of burden sharing for mitigation as well as adaptation that are fair and equitable across nations.
Gender Equity–
- IG should recognize women as agents of sustained socio-economic growth and change
- IG recognises that women are not a homogenous category and ensure that all the differential and specific requirements are catered
Governance–
- IG aim at bringing about major improvements in governance which would make government-funded programmes in critical areas more effective and efficient.
- The best possible way of achieving this objective may be by involving communities in both the design and implementation of such programmes.
- Experience shows that Civil Society Organizations (CSOs) can work with PRIs to improve the effectiveness of these programmes.
- It is especially important to improve evaluation of the effectiveness of how government programmes work and to inject a commitment to change their designs in the light of the experience gained.
- Along with greater transparency and feedback from community participation, this is particularly important in the case of programmes delivering services directly to the poor.
- Accountability and transparency are critical elements of good governance. The Right to Information Act (RTI) enacted in 2005 empowers people to get information and constitutes a big step towards transparency and accountability.
Challenges:
1.Poverty:
- A recent World Bank report published that extreme poverty in India declined by 12.3 % between 2011 and 2019.
- But India still has a long way to go as poverty is one of the causes and reasons hindering inclusive growth.
- The global multidimensional poverty index ranked India 66 out of 109 countries.
2.Unemployment:
- The unemployment among the educated urban youth has increased alarmingly, especially after the Covid-19 pandemic.
- The workforce is mostly employed in informal sectors with no social security.
- Now, the gig economy is taking over the employment market. Though it provides more opportunities to people, it still lacks social security f the employed.
3.Urban and rural divide:
- Rural India is facing agricultural backwardness majorly due to declining per capita land availability and yield due to climate change, land degradation, etc.
- There are significant regional and social disparities between the urban and rural populations and the divide was widened by digital advancement as well.
4.Social issues:
- Social issues like gender disparity, caste system, and religious disparity are also causing hindrance to inclusive growth.
- Malnutrition among children is another worry affecting the future of the country.
India’s Efforts for Inclusive Growth:
- As far as the policy framework is concerned, the govt. lacks a suitable policy vis-a-vis IG.
- Nonetheless, the govt. has experimented with various models of IG.
- According to World Bank’s review of India’s Development Policy, IG policy implementation is facing a dilemma of improving the delivery of core public services, and maintaining rapid growthwhile spreading the benefits of this growth more widely.
- The strategy for the inclusive growth per se needs to be an integrating strategy comprising state, market, civil societies and common man.
- Since independence, the govt. has practiced various types of policy measures –
- Growth oriented policy
- India’s economic planningstarted with growth oriented policy. First plan (1951-56) was started with an objective of rapid and balanced growth. The second plan (1956-61) also put a thrust on rapid growth of industrialization. More recent, twelfth five year plan (2007-12) has blended economic growth with inclusion with an objective of Faster, Sustainable and More Inclusive Growth
- The rate of economic growthhas increased with time, which is a result of radical reforms during 1990s. However, it has failed to emphasize inclusive growth by creating more jobs for low and semi-skilled workers. Growth is not equally shared and in many parts of the country, people still remain poor and disadvantaged in significant proportion.
- Direct intervention
- legislation, regulation, credit facilitation and providing livelihood securityare the forms of direct intervention by the govt.
- Now, the orientation of administrative machinery is transformed from regulator to facilitator.
- At present, direct intervention is in the form of making available the requisite social investment, establishing independent regulatory institutionalmechanism, drafting incentive based policy and encouraging entrepreneurial innovation.
- Capacity Building
- Capacity development is not only limited to skill building or entrepreneurial innovation. Capacity development through training of rural development functionariesis also a mean of capacity building.
- Increasing efficiency, effectiveness, accountability and transparencyare also considered the areas under capacity building initiatives of the govt.
- For example, if the objective of of Rural Development is enhancing the livelihood security of households in rural areas though MNREGAthen capacity building for enhancing effectiveness of Gram Sabha is one of the modalities to achieve the objective.
- Welfare schemes
- Food subsidies, public distributionof essential commodities, nutrition programs, financial support though micro finance are examples of the ways in which welfare schemes are implemented.
- For different types of beneficiaries(women, Children, BPL etc.) central and state govt. have come with the customized welfare schemes.
- The approach in welfare schemes is to benefit the beneficiaries through optimal allocation of resourcesand access to essential services.
- Public Participation
- Without public participationat different level of governance, IG remains a distant dream.
- is encouraging the public participation in multifarious ways towards which the common manmust show an affirmative and pro-active response.
- SHGs promotionis a typical example of public participation for IG. can provide the supporting platform for citizen centric services, the responsibility to deliver still is of the common man.
- Keralasupported Kudumbasreeprogramme have been successful in women empowerment and reducing poverty. Similar initiative of Andhra Pradesh namely ‘Indira Kranti Pathakam’ is showing a good progress in social mobilization, gender empowerment and rural poverty reduction
Lastly, policy intervention takes place both at micro and macro level. Improving fiscal discipline, trade liberalization, promoting Foreign Direct Investment, privatization, deregulation, tax reforms, labour laws, social safety nets, public expenditure etc. are important for macro policy measures while at the micro level, reducing inequality in income, improving public/social infrastructure, healthcare, education, access to essential services, accountability and transparency, women empowerment, role of civil society organizations, etc are instrument of micro policy which needs to be re-worked.
Conclusion –
The approach paper for 11th Five Year Plan acknowledges that the economic growth has failed to be inclusive enough. The failure is a question of willingness, not of capacity. There is no dearth of capacity to achieve the goals of IG but willingness and shortsightedness. With a lot of enthusiasm, policies are framed; proper mechanism of implementation, monitoring and accountability is the central issue of all policies directed towards IG. The onus of IG must be shared by all channel partners state, civil society organization (CSOs) and citizen.
Chapter 24: Land Reforms In India
Background
- Land reforms in India refer to the series of measures taken by the Indian government to redistribute land ownership and reduce land inequality in the country.
- The history of land reforms in India dates to the 1950s when the government initiated a series of measures to redistribute land to the landless and to regulate the rights of tenants.
- The main objective of land reforms in India is to address the problem of landlessness, tenancy, and unequal land distribution, which have been persistent issues in the country.

Need for Land Reform
- By the time British rule ended, intermediary tenures in the zamindari and jagirdari areas, as well as subleasing in the ryotwari areas, had created an agrarian structure in which unproductive interest groups controlled the reins.
- Landlessness, hunger, unemployment, and debt reached unprecedented heights simultaneously as the concentration of land in the hands of a few continued to rise.
- To promote social and economic justice among the farmers.
- The issues were made worse by eviction and a lack of security in the tenancy, both of which required immediate attention in independent India.
- The Agrarian Reforms Committee, led by J.C. Kumarappa as chairman, was set up by the government after Independence to conduct in-depth research on the country’s agrarian relations.
- The committee suggested that the state should eliminate all intermediaries between the tiller and the state, and the tiller should be required to own the land under certain conditions.
The other sides of land reforms
- Land reforms have an angle other than cultivation purposes. The redistribution of land becomes a necessity often for development and manufacturing purposes too.
- This necessitates a proper land policy, which gives due importance to nature, development, and inclusion.
- Deeper structural reforms will ensure that the exercise of land redistribution actually becomes meaningful, enabling small farmers to turn their plots into productive assets.
- When every citizen of the country enjoys the benefits of ownership of land, it can lead to social and economic upliftment.
- There are arguments in favor of and against land reforms.
Arguments in Favor of Land Reforms
- Equity – now the majority of land in India is enjoyed by a minority of landlords.
- The inverse relationship between land size and efficiency – the smaller the land, the better will be the productivity and efficiency.
- Owner cultivation is more efficient than sharecropping.
Arguments Against Land Reforms
- If centrally managed large agricultural land is divided among individual private owners, the peasants who take it up may not be efficient enough to individually carry out the cultivation.
- Results in Fragmentation of land and pockets of inefficiency. For large-scale cultivation, the fragmentation of land normally won’t help (this has another side too – see the inverse relationship).
- Evidence suggests that land reforms had a negative effect on poverty.
- Land reforms have led to economic decline and food insecurity in countries like Zimbabwe.
Major land reforms in India
Abolition of the Zamindari System (1950): The zamindari system was a feudal system of land ownership prevalent in many parts of India. The government abolished this system and transferred the ownership of land to the tillers of the soil.
Tenancy Reforms (1950s-1960s): The government introduced several measures to protect the rights of tenants and regulate their rent. This included the regulation of rent, the prevention of eviction, and the recognition of the rights of sharecroppers.
Ceiling on Land Holdings (1961): The government imposed a ceiling on land holdings, which varied from state to state. This prevented the concentration of land ownership in the hands of a few individuals.
Land Consolidation (1960s-1970s): Land consolidation involved the reorganization of fragmented landholdings to create larger, more productive plots of land. This was done to improve agricultural productivity and reduce the fragmentation of land.
Cooperative Farming (1960s-1970s): The government encouraged cooperative farming to promote the pooling of resources and to increase the bargaining power of small and marginal farmers.
Land Development Banks (1960s-1970s): Land development banks were established to provide credit to farmers for land development, irrigation, and other agricultural activities.
Land Reforms in Kerala (1970s-1980s): The state government of Kerala introduced several land reforms, including the distribution of surplus land to the landless, the imposition of a ceiling on land holdings, and the recognition of the rights of tenants.
Forest Land Distribution (1980s): The government initiated the distribution of forest land to the tribal communities and other marginalized groups to promote their livelihoods and reduce their dependence on forests.
Digitization of Land Records (2008): The government initiated the digitization of land records to ensure the transparency and accuracy of land ownership and transfer.
Land Acquisition, Rehabilitation, and Resettlement Act (2013): The government enacted a new law to regulate the acquisition of land for public purposes and to ensure fair compensation, rehabilitation, and resettlement for those affected by land acquisition.
Conclusion:
An egalitarian society cannot be created until land reforms are undertaken efficiently. With increasing farmer distress, falling productivity levels, and rising suicides, land reforms provide a means to alleviate rural distress. However, this agenda is still unfinished and needs to be effectively revisited and fairly implemented.
Chapter 25: Effects Of Liberalization on Economy
Definition
- Economic liberalization is the process of reducing or eliminating government restrictions on business and commerce.
- Proponents of free markets and free trade, also known as supporters of economic liberalism, are typically those who advance it.
- As a result of economic liberalization, taxes, social security contributions, and unemployment benefits frequently decrease.
When did financial reforms start in India?
India started a grouping of monetary changes on July 23, 1991, because of a financial and balance-of-payment (BoP) emergency. In the years to come, the historic reforms would fundamentally alter the economy’s character and structure.
The BoP crisis was brought on by numerous factors:
- Fiscal Shortfall: In 1990 and 1991, the fiscal deficit was approximately 8.4% of GDP.
- 1991Gulf War: The situation was made worse in 1990 and 1991 when Iraq’s invasion of Kuwait caused the price of oil to rise.
- High inflation: The country’s economic situation deteriorated as a result of a rapid increase in the money supply, which caused the inflation rate to rise from 6.7% to 16.7%.

This led the government to announce New Economic Policy, 1991 which paved the way for economic reforms in form of LPG reforms. The LPG model allowed for a wide range of reforms, including:
- Industrial Policy Liberalization: reductions in import tariffs, the elimination of industrial license-permits raj, and other things
- Start of Privatization: Market deregulation, banking reform, and other things
- Globalization: Changing the exchange rate, opening up trade and foreign direct investment policies, getting rid of mandatory convertibility, etc.
Liberalization’s goals are to encourage private Indian businesses and multinational corporations to participate.
- to make it possible for the Indian economy to become global.
- In order to boost exports, encourage the nation’s foreign trade.
- to find a solution to India’s problem with its balance of payments.
- to increase private sector involvement in India’s economic expansion.
- to increase direct investment from abroad in the Indian industry.
- to promote competition between domestic businesses.
Policies of Liberalization
The liberalization policies which contributed to the expansion of the economy were: Reforms to the financial sector, the industrial sector, the external sector, the foreign exchange sector, and trade and investment policy reforms are all examples of deregulation.
Impact of Liberalization
- Increased Economic Growth: The LPG reforms helped in increasing the rate of economic growth in India. From 1991 to 2020, India’s GDP grew at an average rate of 6.7%, compared to an average rate of 3.5% in the previous three decades.
- Higher Foreign Investment: The LPG reforms opened up several sectors of the Indian economy to foreign investment, leading to an increase in foreign direct investment (FDI) inflows. According to the Ministry of Commerce and Industry, FDI inflows into India increased from $98 million in 1990-91 to $81.72 billion in 2020-21.
- Improvement in Industrial Productivity: The LPG reforms led to the removal of many restrictions on the private sector, which helped in improving the productivity of industries. According to a study by the Reserve Bank of India, the productivity of the Indian manufacturing sector increased by 6.8% annually between 1991 and 2006.
- Expansion of the Services Sector: The LPG reforms led to the growth of the services sector in India, which became a major contributor to the country’s GDP. According to the Ministry of Statistics and Programme Implementation, the services sector’s contribution to India’s GDP increased from 37.2% in 1990-91 to 54.3% in 2020-21.
- Increase in Consumerism: The LPG reforms led to an increase in consumerism in India, as people had access to a wider range of goods and services. According to a study by the National Sample Survey Office, the average monthly per capita expenditure of Indian households increased from Rs. 206 in 1987-88 to Rs. 2,446 in 2017-18.
Negative impacts
- Widening income inequality: According to the World Inequality Database, the top 1% of India’s population held 22% of the country’s wealth in 1991, which increased to 42.5% in 2018. In contrast, the bottom 50% of the population’s share of wealth decreased from 14% in 1991 to 12.5% in 2018. This suggests that the LPG reforms led to a significant increase in income inequality in India.
- Job losses: The Economic Survey of India 2020-21 reported that the unemployment rate in India increased from 3.4% in 2017-18 to 6.1% in 2018-19. This increase was attributed to the slow growth in the manufacturing sector, which was affected by the LPG reforms.
- Increased poverty: According to the World Bank, the poverty rate in India decreased from 36% in 1993 to 9.2% in 2011. However, the rate of poverty reduction slowed down after 2004, with the poverty rate remaining stagnant at around 22%. This suggests that the LPG reforms may have contributed to an increase in poverty in India.
- Environmental degradation: According to the Environmental Performance Index, India ranked 177th out of 180 countries in terms of air quality in 2020. This suggests that the industrialization and increased economic growth resulting from the LPG reforms may have contributed to increased pollution levels in India.
- Dependence on foreign investment: According to the Reserve Bank of India, foreign direct investment (FDI) inflows into India increased from $129 million in 1991 to $81.72 billion in 2020. This suggests that the LPG reforms led to an increased dependence on foreign investment in India’s economy. However, this also made the Indian economy more vulnerable to global economic fluctuations, as foreign investors could easily pull out their investments.
Conclusion
Economic liberalization started in 1991 in India by reviving economic policies, with the goal of creating an economy more market-oriented and increasing the role of private and foreign investment.
Self-reliance and a lack of R&D spending served as roadblocks to technological advancement, which resulted in the manufacture of items of lower quality. In Indian society, there is still a strong assumption that imported items are preferable to domestic ones. It is widely accepted that, before assessing the success of the ongoing industrial policy, consideration must be given to the state of the country following two centuries of exploitation and a horrific separation.
Many factors like lack of tactical skills, low literacy levels, unskilled labor, and absence of technology were significant aspects of the Indian economy before independence. It is stated that industrial strategies, policies, and their restoration are essential for a nation’s economy to thrive.
Chapter 26: Changes in Industrial Policy
Background
- The management of the country’s economy is one of the government’s most important responsibilities. It must choose the means and methods for achieving this. However, this position was not filled by nearly all nations until after the Great Depression.
- Rules, regulations, principles, policies, and procedures established by the government to regulate, develop, and control industrial enterprises in the country are referred to as industrial policy.
- It lays out the roles that the public, private, joint, and cooperative sectors should play in the growth of industries. Additionally, it demonstrates the significance of the large, medium, and small sectors.
- It includes tariff and labor policies, fiscal and monetary policies, the government’s attitude toward foreign capital, and the role that multinational corporations should play in the industrial sector’s development.
Objectives of an Industrial policy
The pursuit of industrial development began shortly after 1947’s independence. The following are the primary goals of the Indian government’s Industrial Policy:
- To keeps up a steady increase in productivity.
- To improve beneficial work.
- To make the most of the human resources available.
- To be competitive on the international stage; and to make India a significant global partner and participant.
Industrial policies in India since independence
India has implemented several industrial policies since independence to promote industrial development and boost economic growth. Here is a brief overview of some of the major industrial policies of India:
- Industrial Policy Resolution, 1948: The Industrial Policy Resolution of 1948 aimed to promote industrial development in the country by encouraging the growth of small-scale industries, promoting private sector investment, and developing infrastructure. The policy focused on the development of the agriculture, consumer goods, and basic industries.
- Industrial Policy Resolution, 1956: The Industrial Policy Resolution of 1956 focused on the development of the public sector and laid the foundation for India’s socialist economic model. The policy aimed to reduce the concentration of economic power in the hands of a few and promote equitable distribution of wealth.
- Industrial Policy Statement, 1973: The Industrial Policy Statement of 1973 aimed to promote self-reliance in the economy by encouraging the growth of indigenous industries, promoting the development of small-scale industries, and providing incentives for export-oriented industries.
- New Industrial Policy, 1991: The New Industrial Policy of 1991 was a major departure from India’s socialist economic model, and aimed to liberalize the economy, reduce government controls, and encourage private sector participation. The policy opened up the economy to foreign investment and encouraged the growth of export-oriented industries and high-technology industries.
- National Manufacturing Policy, 2011: The National Manufacturing Policy of 2011 aimed to increase the share of manufacturing in GDP to 25% by 2022, and focused on improving infrastructure, promoting innovation and technology, and enhancing the skill base of the workforce.
- Make in India, 2014: Make in India is a major initiative launched by the government in 2014 to promote manufacturing in India and attract foreign investment in the sector. The initiative aims to provide a conducive environment for investment, simplify regulations, and provide incentives and benefits to attract investment in the manufacturing sector.
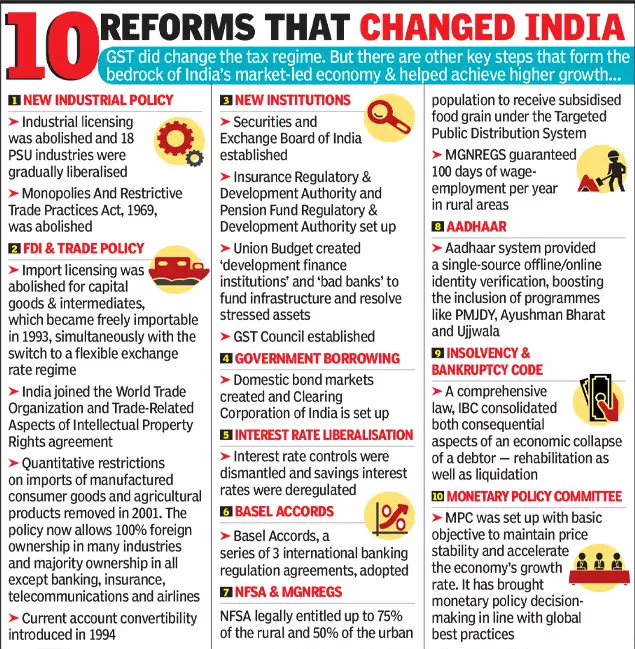
Positive Effects of Industrial Policies
- Economic Growth: Industrial policies have contributed significantly to the economic growth of India. Between 1950 and 2020, the country’s GDP grew at an average annual rate of 6.7%. During this period, the industrial sector’s contribution to GDP increased from 15% to 24%. The manufacturing sector alone contributes around 17-18% of the country’s GDP.
- Employment Generation: The industrial sector is a significant source of employment in India. According to the National Sample Survey (NSS) 73rd round (2015-16), the manufacturing sector provides employment to around 73 million people. The sector employs around 12% of the country’s workforce.
- Regional Development: Industrial policies have helped in promoting regional development in India. The government has established industrial estates and special economic zones in various parts of the country. As of September 2021, there are 438 operational SEZs in India, spread across 21 states and union territories. These SEZs have attracted significant investments and generated employment opportunities.
- Foreign Direct Investment: India’s industrial policies have helped in attracting foreign direct investment (FDI) in the country. According to the Ministry of Commerce and Industry, FDI inflows into India increased from $36.04 billion in 2013-14 to $81.72 billion in 2020-21. The industrial sector accounted for around 18% of the total FDI inflows during this period.
- Technology Transfer: Industrial policies have facilitated the transfer of technology from developed countries to India. The establishment of public sector enterprises and the growth of private sector industries have led to the adoption of modern technologies in various sectors of the economy. India has emerged as a hub for information technology (IT) and IT-enabled services (ITES). According to NASSCOM, the Indian IT-BPM industry is expected to grow at a CAGR of 7.7% to reach $350 billion by 2025.
Negative Impacts of Industrial Policies
- Monopolies and Lack of Competition: One of the major negative impacts of industrial policies in India has been the creation of monopolies and lack of competition in some sectors. The public sector enterprises (PSEs) established by the government enjoyed a monopoly in various industries. For example, until the 1990s, the state-owned Hindustan Aeronautics Limited (HAL) was the sole producer of fighter aircraft in India. This lack of competition resulted in inefficiencies, low productivity, and high costs.
- Inefficient Use of Resources: Industrial policies in India have resulted in the inefficient use of resources, especially in the public sector. The government invested heavily in public sector enterprises, but many of them failed to deliver the expected results. As of March 2020, there were 343 central PSEs in India, of which 79 were loss-making. The government has had to provide financial support to these PSEs, resulting in a drain on public resources.
- Environmental Degradation: Industrial policies in India have also had a negative impact on the environment. The country has witnessed significant environmental degradation due to industrial activities. According to the Central Pollution Control Board, around 30% of India’s total land area is affected by land degradation, and around 70% of surface water resources are polluted.
- Neglect of Agriculture: Industrial policies in India have focused primarily on promoting industrialization, often neglecting the agriculture sector, which employs around 50% of the country’s workforce. The neglect of agriculture has led to a decline in productivity, low income, and poverty in rural areas.
- Inequality: Industrial policies in India have contributed to increasing inequality in the country. The benefits of industrialization have been unevenly distributed, with urban areas benefiting more than rural areas. This has led to a growing income and wealth gap between urban and rural areas and among different social groups.
Way forward/Conclusion
- Since 1991, industrial policies in India have shifted from a primarily socialistic to a capitalist orientation.
- India now has a much more liberal industrial policy that emphasizes less regulation and more foreign investment.
- Make in India and Start up India are two initiatives that have contributed to the improvement of the country’s business environment.
- However, firm growth in India’s industrial sector is still hindered by high electricity costs, credit constraints, labor regulations’ high unit labor costs, political interference, and other regulatory burdens.
- There is a requirement for another Modern Strategy to support the assembling area in the country. In December 2018, the government also felt the need to introduce a new Industrial Policy, which would serve as a guide for all of the country’s businesses.
- India positioned 77th on World Bank’s Carrying on with Work Report 2018. The Bankruptcy and Insolvency Act of 2017 introduced impressive insolvency resolution and Goods and Services Tax (GST) reforms that will benefit the industrial sector in the long run.
While industrial policies in India since independence have had positive impacts on the economy, they have also had negative impacts such as the creation of monopolies, inefficient use of resources, environmental degradation, neglect of agriculture, and inequality. It is important for the government to address these negative impacts and ensure that industrial policies promote inclusive and sustainable growth.
Chapter 27: Infrastructure :Ports in India
Background
- Ports play a crucial role in facilitating international trade and economic development. In India, port infrastructure has been a focus of development for several decades, and the country has made significant progress in this area.
- India has a coastline of over 7,500 kilometers, and the country has 13 major ports and around 200 minor ports. The major ports are managed by the central government, while the minor ports are managed by state governments or private companies.
- The major ports in India are located in Mumbai, Chennai, Kolkata, Visakhapatnam, Kochi, Paradip, Jawaharlal Nehru Port Trust (JNPT), Kandla, Mormugao, New Mangalore, Tuticorin, Ennore, and V.O. Chidambaranar.

Significance of ports for Indian economy
Ports play a vital role in the economic development of a country like India. Some of the key reasons why ports are significant for the Indian economy:
- Facilitating international trade: Ports are the gateways to international trade and facilitate the movement of goods and services between countries. With a vast coastline of over 7,500 kilometers, India has several major and minor ports that handle a significant amount of international trade, including imports and exports. In FY 2020-21, the major ports in India handled 704.8 million tonnes of cargo, comprising a wide range of commodities such as coal, crude oil, iron ore, and containers. Ports play a critical role in facilitating this trade, contributing significantly to the country’s economy.
- Employment generation: Ports are significant employment generators in the country. The development of ports creates several direct and indirect job opportunities, including jobs in port operations, shipping, logistics, and ancillary industries. According to a study by the National Council of Applied Economic Research (NCAER), the port sector has the potential to create around 40 million direct and indirect jobs in India by 2025.
- Boosting economic growth: Ports are essential for the economic growth of a country. They facilitate the movement of goods and services, reduce logistics costs, and enhance connectivity, all of which contribute to the growth of businesses and industries. Ports also play a crucial role in promoting port-led industrialization, creating jobs and boosting economic development in port areas.
- Revenue generation: Ports contribute significantly to the revenue of the Indian government. The revenue generated from port operations includes port dues, berth hire charges, and other charges. The government also earns revenue from land leases and other commercial activities in and around port areas.
- Connectivity:Ports play a critical role in improving connectivity within the country and with other countries. The development of supporting infrastructure, such as road and rail connectivity, enhances the efficiency of port operations and facilitates the movement of goods and people.
- Relations with other nations: Countering China’s influence because China has actively exacerbated India’s transshipment issue with Sri Lanka through its Belt and Road Initiative. China has already leased Sri Lanka’s Hambantota port for 99 years. As a result, India’s development of ports and provision of local transshipment facilities are crucial strategic requirements.
- Integration in the region: As South Asia remains one of the least integrated regions, India’s eastern seaboard can assist in reviving an integrated hub-and-spoke model for regional connectivity in the Bay of Bengal.
- Provider of Net Security in the IOR: A lot of western nations are betting against India’s ability to compete with China in the IOR. By improving its coastal security, ensuring port modernizations, and ensuring its connectivity with the hinterland, India could hedge on their support to realize its goal of becoming a Net Security Provider in the IOR.
Performance of Indian ports
- Cargo handling: Indian ports have recorded consistent growth in cargo handling in recent years. In FY 2020-21, the major ports handled 704.8 million tonnes of cargo, registering a growth of 2.5% over the previous year. This growth was primarily driven by higher coal, container, and iron ore traffic.
- Efficiency: The efficiency of Indian ports has improved significantly in recent years. The average turnaround time (ATT) for vessels at major ports has reduced from 82 hours in 2017-18 to 64 hours in 2019-20. Similarly, the average pre-berthing detention (PBD) time has reduced from 26 hours to 20 hours during the same period. The reduction in ATT and PBD time has improved the overall efficiency of ports and reduced logistics costs for shippers.
- Capacity utilization: Capacity utilization at Indian ports has improved in recent years, driven by infrastructure development and modernization. The average capacity utilization at major ports increased from 67% in 2016-17 to 72% in 2019-20.
- Container traffic: Container traffic at Indian ports has been growing at a steady pace in recent years. In FY 2020-21, the major ports handled 17.5 million TEUs (twenty-foot equivalent units) of containers, registering a growth of 3.7% over the previous year.
- Port-led industrialization: Indian ports have been successful in promoting port-led industrialization, which has created jobs and boosted economic development in port areas. Several major ports have set up industrial clusters and SEZs in and around port areas, attracting investment and generating employment.
Ports led development cases:
- Singapore: Because of its natural deep-sea ports and its position at the crossroads of important shipping routes, Singapore’s trade is a major economic sector, along with services and production.
- China:The Liner Shipping Connectivity Index (LSCI) shows that a number of China’s container ports are among the world’s most connected.
- UK: It is estimated that the ports industry was directly responsible for 57% of GVA, 52% of employment, and 61% of turnover in 2017.
Models of port development
- The service port model: is superior to the landlord port model. The land and all of the available assets—both fixed and mobile—are owned by the port authority, which also handles all port and regulatory duties.
- The port landlord model: Private businesses manage port operations, primarily cargo handling, while the publicly governed port authority serves as a landlord and a regulator. The infrastructure is leased to private businesses, who provide and maintain their own superstructure and install their own equipment to handle cargo. The port authority retains ownership of the port here.
Problems facing the Indian ports sector:
- Congestion: According to a report by the Ministry of Shipping, congestion is a significant problem at major ports in India, with an average turnaround time of 62 hours for vessels in FY 2020-21. This is much higher than the global average of 24-36 hours. The report also notes that the high volume of cargo handled by these ports, combined with limited capacity and infrastructure, has led to significant delays and increased logistics costs.
- Infrastructure: Despite significant investment in port infrastructure development, many Indian ports still lack adequate capacity and infrastructure. According to a report by the National Transport Development Policy Committee, the capacity utilization of major ports in India was around 65% in 2019, indicating that there is still significant scope for improvement. Poor road and rail connectivity to and from ports further adds to the infrastructure-related challenges facing the sector.
- Land acquisition: The acquisition of land for port infrastructure development is often met with opposition from local communities and environmental activists, leading to delays and cost overruns. According to a report by the Parliamentary Standing Committee on Transport, Tourism, and Culture, land acquisition for port development in India has been a significant challenge, leading to delays in several projects.
- Policy and regulatory framework: The policy and regulatory framework governing the ports sector in India is complex and fragmented, leading to delays, confusion, and increased costs. According to a report by the World Bank, the lack of a unified regulatory body and overlapping jurisdictions among different agencies has led to regulatory uncertainty, hindering the development of the sector.
- Technology adoption: The ports sector in India has been slow to adopt new technologies and digital solutions. According to a report by the Confederation of Indian Industry, only a few Indian ports have adopted advanced technologies such as automated container handling systems and smart port solutions. The lack of automation and digitalization of port operations affects the efficiency and competitiveness of Indian ports in the global market.
- Limited Links to the Hinterland: Poor hinterland connectivity via rail, road, highways, coastal shipping, and inland waterways causes inefficiency. This thusly builds the expense of transportation and freight development.
- Effect on the environment
Poor adherence to environmental regulations causes spills and leaks from cargo loading and unloading, as well as oil spill pollution, to occur frequently in ports. Marine ecosystems are in danger from the water released during ship cleaning and ballast water discharge. Digging creates natural issues (expanded sedimentation) influencing neighborhood efficiency of the nearby waters and its fisheries.
Measures to improve the functioning of ports in India
- Capacity expansion: One of the key ways to improve the functioning of ports in India would be to invest in capacity expansion. This could involve expanding existing ports or building new ones to cater to the growing demand for cargo handling. This would require significant investment in infrastructure, including berths, handling equipment, and dredging.
- Automation and digitalization: The adoption of advanced technologies such as automation and digitalization could significantly improve the efficiency and competitiveness of Indian ports. Automation could reduce the reliance on manual labor and increase productivity, while digitalization could improve supply chain visibility and reduce logistics costs.
- Improving connectivity: Improving road and rail connectivity to and from ports would significantly improve the movement of goods, reducing delays and logistics costs. This would require investment in infrastructure such as road and rail networks, as well as the development of multimodal transport solutions.
- Land acquisition: Land acquisition for port development has been a significant challenge in India. Streamlining the land acquisition process and addressing the concerns of local communities and environmental activists could help reduce delays and cost overruns.
- Policy and regulatory framework: Improving the policy and regulatory framework governing the ports sector in India could help reduce regulatory uncertainty and improve the investment climate. This could involve the creation of a unified regulatory body for the sector, simplifying the approval processes, and reducing bureaucratic red tape.
- Public-private partnerships: Encouraging public-private partnerships (PPPs) could help leverage private sector expertise and investment in the ports sector. PPPs could involve the private sector taking on the responsibility for port operations and management, while the government provides the necessary infrastructure and regulatory framework.
Conclusion
Improving the functioning of ports in India would require a multi-pronged approach, involving significant investment in infrastructure, adoption of advanced technologies, improving connectivity, streamlining land acquisition processes, improving the policy and regulatory framework, and encouraging public-private partnerships.
Addressing these challenges would be critical to improving the efficiency and competitiveness of Indian ports and supporting the country’s economic development.
Chapter 28: Infrastructure: Roads
Background:
- India has the second-largest road network in the world, spanning a total of 5.89 million kilometres (kms). This road network transports 64.5% of all goods in the country and 90% of India’s total passenger traffic uses road network to commute.
- Road transportation has gradually increased over the years with improvement in connectivity between cities, towns and villages in the country.
- India’s road network is the busiest for travel and freight. There has been a steady growth in road mobility due to the fast-rising economy, automobile availability, and improved road connectivity.
Classification of roads in India
The roadways in India are classified into four categories: National Highways, State Highways, District Roads, and Village Roads.
- National Highways: These are the primary highways that connect major cities and towns across India. They are maintained by the National Highways Authority of India (NHAI) and are identified by a unique four-digit number. The total length of National Highways in India is around 1,32,500 km.
- State Highways: These are the highways that connect major cities and towns within a state. They are maintained by the respective state governments and are identified by a unique two-digit number. The total length of State Highways in India is around 1,50,000 km.
- District Roads: These are the roads that connect smaller towns and villages within a district. They are maintained by the district authorities and are identified by a unique three-digit number. The total length of District Roads in India is around 4,70,000 km.
- Rural Roads: These are the roads that connect individual villages and hamlets to the rest of the country. They are maintained by the local Panchayats and are identified by a unique four-digit number. The total length of Village Roads in India is around 26,50,000 km.
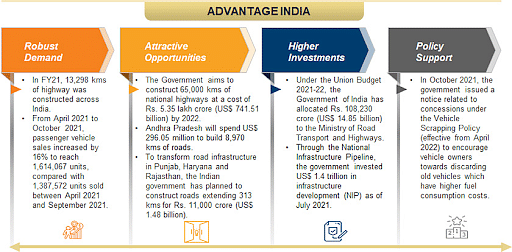
Significance of roads
- Transportation: Roads are the primary mode of transportation in India, with around 90% of the passenger traffic and 60% of the freight traffic being carried by roads. According to the Ministry of Road Transport and Highways, the total length of roads in India is around 59.64 lakh km as of March 2021, making it the second-largest road network in the world.
- Trade and commerce: The development of roads has a significant impact on trade and commerce in India. According to the Ministry of Road Transport and Highways, the total length of National Highways in India has increased from 91,287 km in 2014 to 1,32,500 km in 2021, promoting the movement of goods and services across the country.
- Tourism: India’s road network plays a crucial role in promoting tourism in the country. According to the Ministry of Tourism, around 22.57 million foreign tourists visited India in 2019, generating a revenue of around USD 28.59 billion. The development of road infrastructure has enabled the growth of tourism, connected popular tourist destinations and promoting the growth of the industry.
- Employment: The construction and maintenance of roads provide employment opportunities to millions of people in India. According to a report by the National Highways Authority of India (NHAI), the construction of highways and expressways has created around 55,000 direct jobs and 1,00,000 indirect jobs per 1,000 km of road construction.
- Development: The development of roads in rural and remote areas of India is crucial for promoting overall development. According to the Ministry of Rural Development, around 91% of rural habitations in India are connected by roads, enabling access to essential services like healthcare, education, and markets.
Challenges facing the road sector in India.
- Poor quality of roads: One of the significant challenges facing the road sector in India is the poor quality of roads, especially in rural areas. According to a report by the National Sample Survey Organization (NSSO), around 60% of the rural roads in India are in poor condition, affecting the mobility and safety of people.
- Funding: The road sector requires significant investment to develop and maintain road infrastructure. According to the Ministry of Road Transport and Highways, the estimated cost of developing and upgrading the National Highways network in India is around INR 7.5 lakh crore (USD 103 billion) for the period 2020-2025. However, funding remains a challenge, with budgetary allocations often falling short of the required amounts.
- Land acquisition: Acquiring land for road development is a significant challenge in India, often leading to delays and cost escalations. According to a report by the National Highways Authority of India, land acquisition accounts for around 30% of the total cost of road projects in India.
- Traffic congestion: Traffic congestion is a growing problem in urban areas, affecting the mobility and safety of people. According to a report by TomTom Traffic Index, Mumbai and Delhi are among the top ten cities in the world with the highest traffic congestion levels.
- Safety: Road accidents are a significant challenge facing the road sector in India, with around 1.5 lakh people losing their lives every year. According to a report by the Ministry of Road Transport and Highways, around 80% of road accidents in India are caused by driver errors, highlighting the need for better driver training and road safety measures.
Government initiatives for the road sector in India:
- Bharatmala Pariyojana: Launched in 2017, the Bharatmala Pariyojana is a flagship initiative of the Ministry of Road Transport and Highways aimed at improving road connectivity across the country. Under this initiative, around 34,800 km of National Highways are to be developed at an estimated cost of INR 5.35 lakh crore (USD 73 billion).
- Pradhan Mantri Gram Sadak Yojana (PMGSY): Launched in 2000, PMGSY is a centrally sponsored scheme aimed at connecting rural areas with all-weather roads. Under this initiative, around 1,25,000 habitations have been connected with roads, improving access to essential services like healthcare, education, and markets.
- National Highways Authority of India (NHAI): NHAI is a statutory body under the Ministry of Road Transport and Highways responsible for the development, maintenance, and management of National Highways in the country. NHAI has been implementing several measures to improve road safety, including the installation of crash barriers, median barriers, and road signs.
- India’s Gati Shakti program: has consolidated a list of 81 high impact projects, out of which road infrastructure projects were the top priority. The major highway projects include the Delhi-Mumbai expressway (1,350 kilometres), Amritsar-Jamnagar expressway (1,257 kilometres) and Saharanpur-Dehradun expressway (210 kilometres). The main aim of this program is a faster approval process which can be done through the Gati shakti portal and digitized the approval process completely.
- Road Asset Management System (RAMS): Launched in 2020, RAMS is a web-based platform for the management of road assets, including National Highways and State Highways. RAMS aims to improve the efficiency of road maintenance activities and ensure the optimal use of resources.
- Road Safety: The government has launched several initiatives to improve road safety in the country, including the implementation of the Motor Vehicles (Amendment) Act, 2019, which provides for higher penalties for traffic violations, the installation of speed cameras and red-light cameras, and the promotion of road safety awareness through campaigns and training programs.
Steps Needed to Reform Indian Road Sector
- Increase investment: One of the primary ways to improve the road sector in India is by increasing investment in road infrastructure. This can be achieved by increasing budgetary allocations, encouraging private sector participation, and exploring alternative financing models like public-private partnerships (PPPs) and toll-operate-transfer (TOT) models.
- Focus on road maintenance: Maintaining roads in good condition is critical to ensure their longevity and reduce accidents. The government needs to prioritize regular road maintenance and rehabilitation activities, including resurfacing, pothole filling, and drainage system maintenance.
- Improve land acquisition: Acquiring land for road development is often a time-consuming and expensive process in India. Streamlining the land acquisition process, ensuring transparency, and providing adequate compensation to landowners can help expedite road development projects and reduce costs.
- Use technology: Technology can play a critical role in improving road infrastructure and safety. For instance, using sensors to monitor traffic flow, intelligent transport systems to manage traffic, and smart road infrastructure can help improve road safety and efficiency.
- Promote road safety: Road safety is a significant concern in India, with around 1.5 lakh people losing their lives in road accidents every year. To address this, the government needs to promote road safety awareness, enforce traffic laws strictly, and implement road safety measures like speed limits, pedestrian crossings, and crash barriers.
- Enhance institutional capacity: Strengthening the institutional capacity of government agencies responsible for road development and maintenance can improve the efficiency and effectiveness of road infrastructure development. This can be achieved by investing in training and skill development of personnel, streamlining procedures, and adopting best practices from other countries.
Chapter 29: Infrastructure: Railways
Overview
Indian Railways is the largest rail network in Asia and the world’s second-largest railway system under a single management.
Some facts about Indian Railways:
- Network: Indian Railways covers a distance of over 67,000 km and operates on more than 7,000 stations. It connects almost all parts of the country and transports millions of passengers and goods every day.
- Employees: Indian Railways is one of the largest employers in the world, with over 1.4 million employees. It is also the eighth largest employer in India.
- Passengers: Indian Railways carries over 23 million passengers every day, which is equivalent to the population of Australia. In a year, it carries more than 8 billion passengers, which is more than the population of the entire world.
- Freight: Indian Railways carries over 3 million tonnes of freight every day, which is equivalent to moving the entire population of Mumbai every day. In a year, it transports more than 1 billion tonnes of freight.
- Revenue: Indian Railways is one of the largest revenue generators for the Indian government. In 2019-20, it generated a revenue of over INR 1.9 trillion (approximately USD 25 billion).
- Technology: Indian Railways has introduced several technological advancements in recent years, such as the use of GPS-based train tracking, online reservation system, and bio-toilets in trains.
- Heritage: Indian Railways has a rich heritage, with some of its trains and stations being over a century old. The Darjeeling Himalayan Railway and the Nilgiri Mountain Railway are UNESCO World Heritage Sites.

Contributions of Indian Railways for the country
- Connectivity: Indian Railways connects almost all parts of the country, including remote and inaccessible areas, to the rest of the country. It provides an affordable mode of transportation for millions of people, especially in rural areas, who otherwise may not have access to transportation.
- Employment: Indian Railways is one of the largest employers in the country, providing direct and indirect employment to millions of people. It is a significant source of livelihood for people in both urban and rural areas.
- Goods Transportation: Indian Railways is a lifeline for the country’s economy, transporting millions of tones of goods every year, including raw materials, finished goods, and agricultural produce. It is a cheaper and more eco-friendly mode of transportation compared to road transportation.
- Revenue: Indian Railways is one of the largest revenue generators for the Indian government, contributing significantly to the country’s GDP. The revenue generated by Indian Railways is used for the development of new infrastructure, improving the quality of services, and modernizing the existing system.
- Tourism: Indian Railways is a significant contributor to the country’s tourism industry, with several heritage trains and luxury trains that offer tourists a unique travel experience. The rail network also connects several tourist destinations, making it easier for people to travel within the country.
- National Integration: Indian Railways plays a vital role in promoting national integration by connecting different regions of the country and facilitating the movement of people across different states. It also helps in promoting cultural exchange and promoting unity in diversity.
Challenges faced by Indian Railways
- Capacity Constraints: Indian Railways is one of the busiest railway networks globally, with over 23 million passengers and more than 3 million Tonnes of freight moved daily. However, the capacity of the network is limited, leading to overcrowding and delays. According to the Indian Railways Annual Report 2020-21, around 59% of the mail/express trains ran at a delay of more than 15 minutes in the year 2019-20.
- Safety: Indian Railways faces significant safety challenges, with a high number of accidents and incidents. In the year 2019-20, Indian Railways recorded 59 train accidents and 219 consequential train derailments. These accidents resulted in 120 fatalities and 2,290 injuries, according to the Annual Report of the Ministry of Railways.
- Infrastructure: Indian Railways has an extensive network of tracks, stations, and other infrastructure, but most of it is old and in need of modernization. The infrastructure is also insufficient to cater to the growing demand for transportation. According to a report by the Indian Institute of Management Ahmedabad, the Indian Railways needs to invest around Rs. 50 lakh crores ($676 billion) in the next 30 years to upgrade its infrastructure.
- Funding: Indian Railways is facing funding constraints due to the high cost of infrastructure development and modernization. The government provides most of the funding, and the Railways depend on internal resources to fund its operations. According to the Indian Railways Annual Report 2020-21, the Railways’ gross revenue for 2019-20 was Rs. 2,16,098 crores ($29 billion), out of which the operating expenses were Rs. 1,73,872 crores ($23 billion).
- Competition: Indian Railways faces competition from other modes of transportation, such as roadways and airways. According to the Annual Report of the Ministry of Railways, the market share of Indian Railways in freight transportation declined from 89.6% in 1950-51 to 27% in 2019-20. The competition has put pressure on Indian Railways to improve its services and become more competitive.
- Human Resources: Indian Railways is facing a shortage of skilled human resources, especially in critical areas such as safety, maintenance, and operations. According to the Indian Railways Annual Report 2020-21, the sanctioned strength of employees for Indian Railways was 15.06 lakh as of March 2020, out of which 12.09 lakh were filled, resulting in a vacancy of 19.7%.
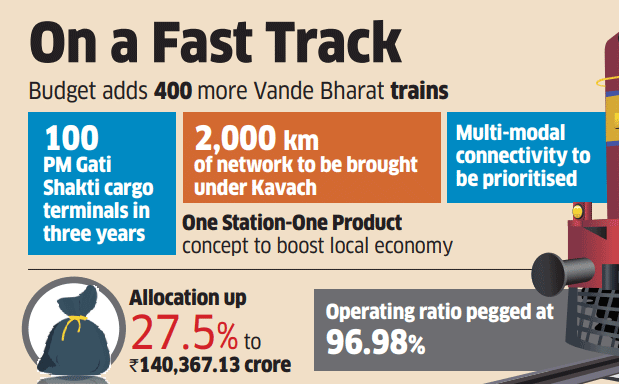
Significance and necessity of the railway reforms
- Growth in the economy: In order for IR to meet the requirements of a $5 trillion economy, reforms are required. In order for IR to make a substantial contribution to the development of India, it requires engineering and administrative reforms to raise costs and reduce environmental impact.
- Departmentalism: The Rail route Board is IR’s pinnacle dynamic body. It is divided into departments like traffic, finance, mechanical, and electrical, which are separated vertically from top to bottom. Because of these lines of separation, IR became a complicated organization with too many departments and inefficient decision-making. The recent IR restructuring reforms, which included reorganizing the Railway Board and combining the existing Group A services into an Indian Railway Management Service (IRMS).
- Reforms to the government: The structure of management must be drastically simplified. The recommendation of the Debroy committee to divide IR’s core functions (rail operations) from its non-core functions (medical, schools, protection force, etc.) makes a lot of sense. Additionally, the Debroy committee recommends a revised governance structure with decision-making authority and some distance from the government.
- Modernizations: Indian Railways has been unable to expand at the rate required by India and keep up with infrastructure and service modernization. Equipment, procedures, and training all need to be updated in almost every sector of the railways, which has been the case for decades. As a result, the railways continue to consume public funds while providing essential services inefficiently.
- Safety: India has a lot of rail accidents. Railways were responsible for 16 deaths in 2018-19, 28 deaths in 2017-2018, and 195 deaths in 2016-2017. The Kakodkar committee had proposed establishing a statutory railway safety authority and investing Rs 1 lakh crore over five years.
Privatization of the Railways
- Through 151 new trains, the Indian Railways started the process of allowing private companies to operate passenger trains on its network. This marks the beginning of private sector participation in passenger train operations, even though these trains will comprise a negligible portion of the entire railway network.
- The former Planning Commission of India and the current Niti Aayog have both recommended privatizing Indian railways for a number of decades.
- In the public transportation industry, which is still controlled by the government, allowing new operators to enter may be the way to improve services and encourage growth. However, there are advantages and disadvantages to privatization as a concept.
Targets of the drive:
- to introduce modern rolling stock that requires less upkeep.
- Speed up the journey.
- Boost employment growth.
- Provide increased security.
- Passengers should be treated to an exceptional travel experience.
- Reduce the passenger transportation sector’s demand-supply imbalance.
Benefits of Privatization of Indian Railways
- Improved Infrastructure: The Niti Aayog strategy for New India @75 includes a number of goals for railway infrastructure, such as electrifying 100 percent of broad gauge track by 2022-23 and increasing the speed of infrastructure creation from the current 7 km/day to 19 km/day.
- Because of this, a strong argument in favor of privatization is that it will result in improved infrastructure, which would improve safety, shorten travel times, and other benefits.
- Improved Service Quality: There are problems with Indian Railway services like being late, mismanagement that results in stale restrooms, a lack of water, and dirty platforms. These problems may be solved by privatization because it would increase competition and improve service quality overall.
- Infusion of Technology: The privatization will also make it easier to incorporate the most recent technology into railway coaches, improving safety and the travel experience. As a result, it may assist Indian Railways in developing into a world-class network.
Cons of privatization
- Limited Coverage to Lucrative Sectors: One benefit of Indian Railways being owned by the government is that it provides nationwide connectivity, which contributes to regional development. This wouldn’t be imaginable with privatization since courses which are less well known might be dismissed, subsequently adversely affecting network.
- Additionally, it may exclude some areas of the country from the development process and render them virtually inaccessible. For instance, states in the Himalayas and the North Eastern United States have rugged terrain and low population densities.
- Increased Fees: Given that Indian Railways is a private business that relies on revenue, it stands to reason that raising fees would be the simplest way to increase profits. Because of this, people with lower incomes would not be able to afford the service. Additionally, this would be counterproductive to the goal of the Indian railways, which is to provide services to the nation’s entire population regardless of income.
- Problem of Cross-Subsidization: Indian Railways typically use freight revenue to cross-subsidize passenger fares. Private players will have a hard time competing as a result of lower pricing as a result.
- Conflict of Interest: At the moment, the Ministry of Railways is essentially the provider of services, regulator, and policy. The Bibek Debroy committee pointed out that this is a clear conflict of interest, would hinder the effective privatization of Indian Railways, and would make it harder for private and government railway operations to compete fairly.
- Concerns for social welfare: The Indian Railways provide low costs for the transportation of many final and intermediate goods because they play a crucial role in the country’s goods transportation. As a result, the common people will be impacted by the inflationary effects of the system privatization driven by profit-seeking.
Steps to reform Indian Railways
- Separation of Rail Budget: In 2017, the government separated the Rail Budget from the Union Budget, which was aimed at improving financial transparency and accountability of the Indian Railways.
- Setting up of Dedicated Freight Corridors (DFC):The government is constructing DFCs for freight movement between Delhi and Mumbai, and Delhi and Kolkata. These corridors are expected to reduce transit time, congestion, and accidents, and improve the competitiveness of Indian Railways.
- Restructuring of Railway Board:The government has approved the restructuring of the Railway Board, which aims to improve the efficiency and decision-making of Indian Railways. The Board will now have four members, including the Chairman, and will focus on specific areas such as infrastructure, operations, and finance.
- Public-Private Partnership (PPP) Model: The government has encouraged private participation in the development of Indian Railways through the PPP model. It has initiated projects such as the development of railway stations, setting up of locomotive factories, and introduction of high-speed trains through the PPP model.
- Modernization of Signaling and Telecommunication: The government is investing in modernizing signaling and telecommunication systems to improve safety and efficiency. The introduction of the European Train Control System (ETCS) is expected to improve safety, reduce accidents, and enable high-speed trains in the future.
- Train Operations and Management System (TOMS):The government has introduced TOMS, an IT-enabled system for efficient management of train operations. It is expected to improve the punctuality of trains, optimize resource utilization, and reduce costs.
- Improvement in Passenger Services: The government has introduced several measures to improve passenger services, such as the introduction of bio-toilets, online ticketing, and e-catering services. It is also planning to introduce modern coaches with improved amenities and safety features.
Programmes launched.
- Construction of Dedicated Freight Corridors: are the purpose of the DFCs is to increase the proportion of freight traffic. They should be functional by 2022. However, completion is anticipated for 2023 and 2024. DFCs consist of 2 corridors:
- Western Dedicated Freight Corridor (WDFC): Mumbai-to-Uttar Pradesh
- The Eastern Dedicated Freight Corridor (EDFC): Dankuni in West Bengal with Ludhiana in Punjab.
- Rail Kisan: The beginning of ‘Kisan Rail’ is one more significant drive to further develop the cargo business overall and give a push to ranchers specifically. Over 49,000 Tonnes of goods are being transported by 157 trains on eight routes under this program.
- Program for the Redevelopment of Station Infrastructure: The Public authority of India has sent off the station redevelopment program, which intends to redevelop 400 rail route stations across India for INR 1,000 billion under a public-private organization (PPP) model. The program will attempt to foster self-supportable railroad stations with elevated expectations of wellbeing, solace, easy to understand traveler conveniences, esteem added administrations and effectiveness by embracing the best mechanical practices.
- Connecting the Mining Districts and the North East: As part of inclusive development, the North-east’s railway connectivity is being improved. Broad gauge is being connected to the entire North-East (NE) rail network. The Northeastern States’ major cities are being connected by rail. Additionally, the Railways have launched the “Mission Hungry for Cargo” initiative, which aims to increase the modal share of freight transportation from the current 27% to 45%. In addition, the country’s railways are mapping mining districts to improve their railway connectivity.
- Quest for Self-reliance: As part of “Atma Nirbhar Bharat,” “Kavach,” an indigenously developed anti-collision system with world-class technology to prevent accidents, will cover 2,000 kilometers of the rail network. Kavach will assist the railways in achieving their objective of zero accidents. Indian Railways plans to introduce 400 new-generation, highly energy-efficient “Vande Bharat” high speed trains within the next three years, with the goal of improving the passenger experience. The quick implementation of these initiatives ought to be the focus.
Bibek Debroy Committee
The Bibek Debroy Committee was formed in 2014 by the Ministry of Railways to suggest measures for the restructuring of the Indian Railways. The committee submitted its report in 2015, and some of its key recommendations are:
- Restructuring of Indian Railways: The committee recommended the restructuring of Indian Railways into a government-owned company, which would have more autonomy in decision-making and financial management.
- Creation of Regulatory Framework: The committee suggested the creation of a regulator for Indian Railways, which would oversee tariff setting, infrastructure development, safety, and service standards.
- Privatization of Railway Operations: The committee recommended the gradual privatization of railway operations, starting with the outsourcing of non-core services such as catering, cleaning, and maintenance.
- Investment in Infrastructure: The committee suggested that Indian Railways should invest in infrastructure development to improve connectivity, safety, and efficiency. It recommended the construction of dedicated freight corridors, high-speed trains, and electrification of the railway network.
- Tariff Rationalization: The committee recommended the rationalization of freight tariffs to encourage the transport of bulk commodities by rail, which would increase revenue for Indian Railways.
- Cost Cutting Measures: The committee suggested cost-cutting measures such as reduction in staff strength, elimination of redundant posts, and streamlining of administrative procedures.
- Restructuring of Human Resources: The committee recommended the restructuring of human resources in Indian Railways to improve productivity, skill development, and performance management.
Chapter 30: Infrastructure: Airports
Background:
- The aviation industry in India has seen significant growth over the past decade. India has become one of the fastest-growing aviation markets in the world, with a high demand for air travel due to a growing middle class, increasing disposable income, and a thriving tourism industry.
- The aviation industry in India is mainly divided into two segments: scheduled airlines and non-scheduled airlines. Scheduled airlines operate regular flights on a predetermined schedule and include major players like Air India, IndiGo, SpiceJet, Vistara, and GoAir. Non-scheduled airlines, also known as charter airlines, operate flights on demand and cater to a specific customer base.
Some data and facts about the Indian aviation industry:
- India has the third-largest domestic aviation market in the world after the United States and China. In 2019, Indian airlines carried over 140 million domestic passengers.
- The Indian aviation industry has seen rapid growth in the past decade. In 2010, the Indian aviation industry carried around 61 million domestic passengers, which has grown by over 130% to over 140 million domestic passengers in 2019.
- The Indian aviation industry is expected to be the world’s largest by 2030, with an estimated 572 million passengers expected to travel by air in India.
- The Indian aviation industry is dominated by low-cost carriers (LCCs) like IndiGo, SpiceJet, and GoAir, which account for around 70% of the domestic market share.
- The busiest airport in India is the Indira Gandhi International Airport in Delhi, which handled over 69 million passengers in 2019. The Mumbai Chhatrapati Shivaji Maharaj International Airport is the second busiest, with over 48 million passengers in 2019.
- The Indian aviation industry has a strong focus on safety, and the country’s Directorate General of Civil Aviation (DGCA) is responsible for ensuring safety standards are met. In 2020, the DGCA was recognized by the International Civil Aviation Organization (ICAO) for its safety oversight program.
- The Indian government has introduced policies like the Regional Connectivity Scheme (RCS) to improve air connectivity to remote and regional areas of the country. Under the RCS, airlines are given financial incentives to operate flights to remote and underserved areas.
- The Indian aviation industry has faced several challenges in recent years, including high operating costs, regulatory issues, and intense competition among airlines. The COVID-19 pandemic has also severely impacted the industry, leading to a significant decline in air traffic and revenues.
- The Indian aviation industry has been liberalized in recent years, with the government relaxing foreign direct investment (FDI) rules, allowing up to 100% FDI in the aviation sector. This has encouraged foreign investors to enter the Indian market, leading to increased competition and growth in the industry.
Significance for the Indian economy
- Contribution to GDP: The aviation sector directly contributes to the Indian economy’s Gross Domestic Product (GDP). The sector’s contribution to GDP has been steadily increasing, and it was estimated to be around 7.5% in 2019.
- Job creation: The aviation sector is a significant employer, generating direct and indirect employment opportunities. The sector employs people in various fields, including pilots, cabin crew, airport personnel, ground handlers, and maintenance staff. In 2019, the sector was estimated to employ around 4.4 million people.
- Facilitating business and trade: The aviation sector plays a crucial role in facilitating business and trade in India. It enables the movement of goods, services, and people across the country and the world, facilitating international trade and commerce.
- Boost to tourism: The aviation sector plays a significant role in the growth of India’s tourism industry. India has a rich cultural and historical heritage, and the aviation sector helps connect tourists to various tourist destinations across the country. The sector also facilitates inbound tourism, which generates foreign exchange earnings for the country.
- Regional development: The aviation sector also helps in the development of remote and regional areas by providing air connectivity to these areas. This helps in the growth of businesses, improves access to healthcare and education, and creates employment opportunities in these regions.
- Challenges Being Faced by the Indian Aviation Sector
High operating costs: According to the Directorate General of Civil Aviation (DGCA), aviation turbine fuel (ATF) prices in India increased by 28.5% in January 2022 compared to the same month in the previous year. In a survey conducted by the International Air Transport Association (IATA) in 2021, Indian airlines reported the highest operating costs in the Asia-Pacific region, mainly due to high fuel prices and airport charges. According to the Centre for Asia Pacific Aviation (CAPA), the Indian aviation industry is expected to post losses of $2.5 billion to $3 billion in the financial year 2021-22 due to high operating costs and low demand for air travel. - Infrastructure constraints: According to the Airports Authority of India (AAI), the country’s major airports are operating at or above their capacity, leading to congestion and delays. According to the Ministry of Civil Aviation, India has a limited amount of airspace available for commercial aviation, which can lead to flight delays and affect the quality of passenger experience. In a report by the World Economic Forum, India ranked 103rd out of 141 countries in terms of airport infrastructure quality in 2021.
- Intense competition: The Indian aviation market is highly competitive, with several low-cost carriers and full-service airlines vying for market share. This intense competition has led to price wars and reduced profitability for airlines. According to a report by CAPA, Indian airlines collectively posted losses of $4.1 billion in the financial year 2020-21 due to intense competition and the impact of the COVID-19 pandemic.
- Regulatory challenges: According to a report by the Ministry of Civil Aviation, airlines in India have to comply with over 200 regulations, which can be time-consuming and costly, especially for smaller airlines. In a survey conducted by IATA, Indian airlines reported the highest levels of regulatory compliance costs in the Asia-Pacific region in 2021.
- Skilled workforce shortage: According to a report by CAPA, the Indian aviation industry faces a shortage of skilled personnel, including pilots, engineers, and ground staff. The report estimates that the industry will need to hire over 200,000 personnel by 2030 to meet the growing demand for air travel. In a survey conducted by IATA, Indian airlines reported the highest levels of staff training costs in the Asia-Pacific region in 2021.
- Economic and political instability: According to a report by IATA, India’s aviation industry is vulnerable to economic and political instability, which can impact the demand for air travel, increase fuel prices, and limit the availability of capital for investment. The COVID-19 pandemic has further exacerbated the economic and political challenges faced by the Indian aviation sector.
Steps taken by government.
The Government of India has taken several steps to promote and support the aviation sector in the country. Here are some of the key initiatives taken by the government:
- Regional Connectivity Scheme (RCS): The RCS, also known as UDAN (Ude Desh Ka Aam Nagrik), was launched in 2016 to improve air connectivity to remote and regional areas of the country. The scheme aims to make air travel affordable for the common man by capping fares at INR 2,500 ($34) per hour of flight on RCS routes.
- Liberalization of FDI rules: The government has relaxed foreign direct investment (FDI) rules in the aviation sector, allowing up to 100% FDI under the automatic route. This has encouraged foreign investors to enter the Indian market, leading to increased competition and growth in the industry.
- National Civil Aviation Policy (NCAP): The NCAP was launched in 2016 to provide a roadmap for the growth and development of the aviation sector in India. The policy aims to make flying affordable, convenient, and safe for passengers, promote regional connectivity, and enhance the overall competitiveness of the sector.
- Make in India: The government’s Make in India initiative aims to promote domestic manufacturing and support the growth of the aviation industry. Under this initiative, the government has encouraged global aerospace companies to set up manufacturing units in India, which will boost the domestic aviation industry and create job opportunities.
- Airports Authority of India (AAI) modernization: The AAI is responsible for managing and developing airports in India. The government has initiated a modernization program for the AAI to improve airport infrastructure, upgrade technology, and enhance passenger services.
- GST relief: The government has provided relief to the aviation industry by reducing the Goods and Services Tax (GST) on air travel from 18% to 5% on economy class tickets and from 28% to 5% on business and first-class tickets.
Chapter 31: Infrastructure: Energy
Background:
- Power is among the most critical components of infrastructure, crucial for the economic growth and welfare of nations. The existence and development of adequate power infrastructure is essential for sustained growth of the Indian economy.
- The fundamental principle of India’s power industry has been to provide universal access to affordable power in a sustainable way.
- The Government has made significant efforts over the past few years to turn the country from one with a power shortage to one with a surplus by establishing a single national grid, fortifying the distribution network, and achieving universal household electrification.
- is one of the most diversified in the world. Sources of power generation range from conventional sources such as, lignite, natural gas, oil, hydro and nuclear power, to viable non-conventional sources such as wind, solar, agricultural and domestic waste.
- Electricity demand in the country has increased rapidly and is expected to rise further in the years to come. In order to meet the increasing demand for electricity in the country, massive addition to the installed generating capacity is required.
Facts Associated with Power Sector in India:
- India was ranked 4th in wind power, 5th in solar power and 4th in renewable power installed capacity, as of 2020.
- India is the only country among the G20 nations that is on track to achieve the targets under the Paris Agreement.
- As of October 31, 2022, India’s installed capacity stood at 165.94 GW, representing 40.6% of the overall installed power capacity.
- Solar energy is estimated to contribute 61.62 GW, followed by 41.84 GW from wind power, 10.70 GW from biomass, 4.92 GW from small hydropower, and 46.85 GW from hydropower.
- The peak power demand in the country stood at 210.79 GW on June 9, 2022.
Why is India at an Advantage:
Growing Demand:
-
- India is the third-largest producer and consumer of electricity worldwide, with an installed power capacity of 408.71 GW as of October 31, 2022.
- Growing population along with increasing electrification and per-capita usage will provide further impetus. Power consumption is estimated to reach 1,894.7 TWh in 2022.
- Attractive Opportunities:
- Under the Union Budget 2022-23, the government announced the issuance of sovereign green bonds, as well as conferring infrastructure status to energy storage systems, including grid-scale battery systems.
- In the same budget, Rs. 19,500 crore (US$ 2.57 billion) was allocated for a PLI Scheme to boost manufacturing of high-efficiency solar modules.
- Policy Support:
- 100% FDI allowed in the power sector has boosted FDI inflow in this sector.
- Schemes such as Deen Dayal Upadhyay Gram Jyoti Yojana (DDUGJY) and Integrated Power Development Scheme (IPDS) are expected to augment electrification across the country.
- Higher Investments:
- As per the National Infrastructure Pipeline 2019-25, energy sector projects accounted for the highest share (24%) out of the total expected capital expenditure of Rs. 111 lakh crore (US$ 1.4 trillion).
- Total FDI inflow in the power sector reached US$ 16.39 billion between April 2000-June 2022.
Issues Associated with Power Sector
- Challenges in fuel supply: include unequal contractual provisions, inadequate supply, and poor transport logistics. Coal is transported over long distances through railways, but such long haulage leads to increased delivery costs, thefts and life-cycle energy consumption.
- Challenges to open access: While all states in India have notified open access, only 19 have determined all the charges (cross-subsidy charges, wheeling charges, transmission charge) on open access.
- Poor financial health of DISCOMS: The main causes of which include unmetered consumption, low collection efficiency, and high technical losses due to insufficient capital expenditure on up-gradation of existing infrastructure. The extent of commercial losses of DISCOMS across India increases by over 50% in the absence of subsidy.
- High Transmission & Distribution Losses: averaging about 22.3% of electricity which is very high as compared to those of the developed countries (6-11%).
- Under-procurement of power by states – cancelling out costlier Power Purchase Agreements (PPAs) in Favour of newer and cheaper agreements.
- Coordination Issues: Multiple ministries and agencies are currently involved in managing energy-related issues which presents challenges of coordination and optimal resource utilization, thus undermining efforts to increase energy security.
Government Policies & Initiatives
The Government of India has identified the power sector as a key sector of focus to promote sustained industrial growth. Some initiatives by the Government to boost the Indian power sector are as below:
- In the Union Budget 2022-23, the government allocated Rs. 19,500 crore (US$ 2.57 billion) for a PLI scheme to boost manufacturing of high-efficiency solar modules.
- As of August 24, 2022, over 36.86 crore LED bulbs, 72.18 lakh LED tube lights and 23.59 lakh energy-efficient fans have been distributed across the country, saving around 48,411 million kWh per year and around Rs. 19,332 crore (US$ 2.47 billion) in cost savings.
- As of November 2022, over 51.62 lakh smart meters have been deployed under the National Smart Grid Mission (NSGM), with a further 61.13 lakh to be deployed.
- Electrification in the country is increasing with support from schemes like Deen Dayal Upadhyay Gram Jyoti Yojana (DDUGJY), Ujwal DISCOM Assurance Yojana (UDAY), and Integrated Power Development Scheme (IPDS).
- In order to meet India’s 500 GW renewable energy target and tackle the annual issue of coal demand supply mismatch, the Ministry of Power has identified 81 thermal units which will replace coal with renewable energy generation by 2026.
- In February 2022, a committee the government to take steps to increase the loan limit for the renewable energy sector under priority sector lending. The current limit stands at Rs. 30 crore (U$ 3.93 million).
- In November 2021, the government announced future plans to increase the funding under the PLI scheme for domestic solar cells and module manufacturing to Rs. 24,000 crore (US$ 3.17 billion) from the existing Rs. 4,500 crore (US$ 594.68 million) to make India an exporting nation.
- In November 2021, Energy Efficiency Services Limited (EESL) stated that it will partner with private sector energy service companies to scale up its Building Energy Efficiency Programme (BEEP).
- The Pradhan Mantri Sahaj Bijli Har Ghar Yojana, “Saubhagya”, was launched by the Government of India with an aim of achieving universal household electrification. As of March 2021, 2.82 crore households have been electrified under this scheme.
Road Ahead
- In the current decade (2020-2029), the Indian electricity sector is likely to witness a major transformation with respect to demand growth, energy mix and market operations.
- India wants to ensure that everyone has reliable access to sufficient electricity at all times, while also accelerating the clean energy transition by lowering its reliance on dirty fossil fuels and moving toward more environmentally friendly, renewable sources of energy.
- Future investments will benefit from strong demand fundamentals, policy support and increasing government focus on infrastructure.
- The Government of India is preparing a ‘rent a roof’ policy for supporting its target of generating 40 GW of power through solar rooftop projects by 2022. It also plans to set up 21 new nuclear power reactors with a total installed capacity of 15,700 MW by 2031.
- The Central Electricity Authority (CEA) estimates India’s power requirement to grow to reach 817 GW by 2030. Also, by 2029-30, CEA estimates that the share of renewable energy generation would increase from 18% to 44%, while that of thermal energy is expected to reduce from 78% to 52%.
Chapter 32: Cropping Patterns in India
Current Agri-crop situation in India:
- India is the world’s second largest producer of both rice and wheat.
- Cultivated on 45 million hectares in kharif and rabi seasons, rice production has consistently risen over the years from 104.4 million tonnes (mt) in 2015-16 to 117.9 mt in 2019-20.
- Wheat, a rabi crop, is planted on around 30 million hectares and its harvest stood at 107.2 mt in 2019-20, up from 92.3 mt five years ago.
- Annual hikes in the minimum support price combined with the system of open-ended procurement through the Food Corporation of India (FCI) have contributed not only to increase in harvest size but also burgeoning public stocks of the two fine cereals.
- Grain mono-cropping — cultivation of rice and wheat in an unbroken chain season after season — in major growing States such as Punjab and Haryana over the last 20-30 years is inflicting enormous invisible costs.
- In the absence of scientific crop rotation, soil health has deteriorated.
- Encouraged by free power supply, reckless drawing of groundwater for irrigation has resulted in the water table going down to alarmingly low levels.
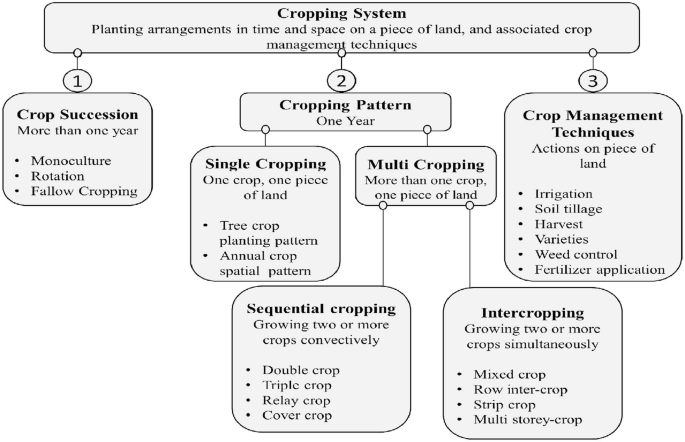
- Cropping system = Cropping pattern + Interaction (input, technology)
- Farming system = Cropping system + Interaction (other enterprise)
Crop Classification Based on the Type of Produce
A variety of food and non-food crops are grown in different parts of the country depending upon the variations in soil, climate, and cultivation practices. These crops can be classified on the basis of different criteria enumerated below:
|
Food crops: |
· The Food Crop refers to plants, which provide food for human consumption, cultivated by man by agriculture. · E.g. rice, wheat, maize, millets- jowar, bajra, ragi; pulses- gram, tur(arhar) etc. (Cereal- grass like plants with starchy edible seeds having high nutritional value) |
|
Cash Crop: |
· A cash crop or profit crop is an agricultural crop which is grown to sell for profit. It is typically purchased by parties separate from a farm. · E.g. Cotton, jute, sugarcane, tobacco, oilseeds, groudnut, lineseed, sesamum, castor seed, rapeseed, mustard etc. |
|
Plantation Crop: |
· A plantation is a large-scale estate meant for farming that specializes in cash crops. · E.g. tea, coffee, coconut, areca nut, rubber and spices, cademom, chillies, ginger, turmeric etc. |
Agriculture Season in India
|
|
Kharif crops |
Rabi crops |
Zaid crops |
|
Time |
Also known as Monsoon crops, they are sown when the rainy season begins (April-May). Harvesting is done in September-October. |
Also known as winter crops, they are sown when their winter season ends (September-October). Harvesting is done in June-July. |
These are summer season crops. They are grown in the short duration between Rabi and Kharif crop season (March to June). |
|
Condition |
Require wet and hot conditions to grow |
Require cold and relatively dry conditions to grow |
Mostly sown in Gangetic belts of the region. |
|
Examples |
Rice(Paddy), Maize, Groundnut, cotton, Soybean, Pigeon Pea(arhar), Mung bean, Red chillies, Sugarcane, Turmeric, Millets like Ragi, Jowar, Bajra |
Wheat, Chickpea, mustard, linseed, oats, barley, Sesame, Peas, Sunflower, Coriander, Onion, Potato, Tomato, alfalfa, cumin, mustard, fenugreek, fennel |
Cucumber, watermelon, Muskmelon, bitter gourd, pumpkin, ridged gourd |
Major food crops
Rice –
- Rice crop needs a hot and humid climate. It is best suited for regions which have high humidity, prolonged sunshine and an assured supply of water.
- Rice is a crop of tropical climate. However, it is also grown successfully in humid to sub-humid regions under subtropical and temperate climate.
- Major Rice Producing States – West Bengal, Punjab, Uttar Pradesh, Andhra Pradesh, Chattisgarh, Assam
- Varieties of Rice in news “Kalanamak” – Kalanamak is one of the finest quality scented rices of India. It is quite popular in Himalayan Tarai of eastern Uttar Pradesh, India, and is also known as the scented black pearl of Uttar Pradesh.
- “Pokalli” – The pokkali variety of rice is known for its saltwater resistance and flourishes in the rice paddies of coastal Alappuzha, Ernakulam and Thrissur districts of Kerala.
- At the end of fiscal year 2019, India had approximately 44 million hectares of land area for cultivation of rice.
-
Wheat
- The temperature required for wheat during growing season is around 15.5°C. The weather should be warm and moist during the early stage of growth and sunny and dry in the later stages
- This is the second most important cereal crop and the main food crop, in north and north-western India.
- Major States – UP, Punjab, Madhya Pradesh, Haryana, Rajasthan
-
Millets
- The government has renamed jowar, bajra, ragi and other millets as “Nutri Cereals”, dispensing with the nomenclature “coarse cereals”.
- Millets comprising Sorghum (Jowar), Pearl Millet (Bajra), Finger Millet (Ragi/Mandua), Minor Millets — Foxtail Millet (Kangani/Kakun), Proso Millet (Cheena), Kodo Millet (Kodo), Barnyard Millet (Sawa/Sanwa/ Jhangora), Little Millet (Kutki) and two Pseudo Millets (Black-wheat (Kuttu) and Ameranthus (Chaulai) which have high nutritive value are reffered as “Nutri Cereals”
- Millets hold great potential in contributing substantially to food and nutritional security of the country and thus they are not only a powerhouse of nutrients, but also are climate resilient crops and possess unique nutritional characteristics.
- To popularise the consumption of these nutritious cereals, the government has already decided to include millets in the Public Distribution System (PDS) with the objective of improving nutritional security of the country.
- Millets can be cultivated in dry regions. They are suited for Dryland agriculture (DLA) such as Ragi, Sorghum
- Major States Karnataka, Rajasthan, Maharastra, Madhya Pradesh, Uttar Pradesh.
-
Maize
- Maize (Zea mays L.) is one of the most versatile emerging crop shaving wider adaptability under varied agro-climatic conditions. Globally, maize is known as queen of cereals because it has the highest genetic yield potential among the cereals.
- Maize can be cultivated in different types of climates, but the growth, development and yield of maize is found more in the hot regions. It is a hot season crop
- It is used both as food and fodder
- Major States Karnataka, Madhya Pradesh, Maharastra, Tamil Nadu.
-
Pulses
- Pulse crops are cultivated in Kharif, Rabi and Zaid seasons of the Agricultural year.
- Rabi crops require mild cold climate during sowing period, during vegetative to pod development cold climate and during maturity / harvesting warm climate.
- Similarly, Kharif pulse crops require warm climate throughout their life from sowing to harvesting. Summer pulses are habitants of warm climate.
- Seed is required to pass many stages to produce seed like germination, seedling, vegetative, flowering, fruit setting, pod development and grain maturity / harvesting
- The lower productivity of pulses is attributed to a paradigm shift in area under cultivation of traditional crops to the cash crops with the impact of technology and income, non-availability of high yielding and good quality seed to the farmers, poor crop management practices like low fertilizer use.
- Pulses are poor in harvesting the solar energy and converting it to biological yield.
- Major Pulse Producing states Madhya Pradesh, Rajasthan, Maharashtra, Karnataka
6.Sugarcane
- Sugarcane is a tropical plant, therefore, requires a year warm weather to reach maturity. The areas having temperature of 20° to 26°C and an average rainfall of 150 cm are suitable for its cultivation.
- Uttar Pradesh and Bihar were top sugar producing states once upon a time. However, they have lost their position to states such as Maharashtra and Tamil Nadu. The sugar industry of India is gradually shifting from north India to peninsular India because of
- The tropical climate of Peninsular India results in higher yield per unit hectare of land
- Higher sucrose content in peninsular cane
- Long crushing season in south. In North India, it lasts from November to February (4 months); while in South it lasts from October to May or even June (nearly 8 months)
-
Oil Seed
- Main oil-seeds produced in India are groundnut, mustard, coconut, sesamum (til), soyabean, castor seeds, cotton seeds, linseed and sunflower.
- Groundnut is a kharif crop and accounts for about half of the major oilseeds produced in the country.
- Major states Gujrat, Madhya Pradesh, Rajasthan, Gujrat, Maharastra, UP
- The policy impetus to oilseed production in India came for the first time in 1986 when the government launched Technology Mission on Oilseed. This was a golden period for oilseed production in India when productivity jumped from 670 kg per hectare in the eighties to 835 kg per hectare in the nineties.
- To achieve self-sufficiency in edible oils production the government has launched several policy initiatives since the mid-1980s.
- They mainly include supply of high yielding oilseed cultivars, extension services and subsidised inputs; offering of minimum support prices (MSP); fixation of price band; import controls via canalisation; and promotion of oil palm cultivation.
- The outcome of these initiatives, known as “Yellow Revolution”, were highly encouraging. Between 1985 and 1994 the growth rate of area, production and yield of oilseeds increased significantly.
- As a result, the proportion of imported edible oils in total edible oil availability declined from 26.72 per cent in 1985 to 2.17 per cent in 1993, thereby making India almost self-sufficient in edible oil production.
Horticulture Crops
- Horticulture is the branch of agriculture concerned with cultivation, production and sale of fruits, vegetables, flowers, herbs, ornamental or exotic plants.
- The second advance estimates also places total horticulture production in 2019-20 to be at 320.48 million tonnes. This figure displays the growing popularity of horticulture crops in India.
- The total horticulture production has increased from 211.2 million tonnes in 2007-08 to 311.71 million tonnes in 2018-19.
- India is the second largest producer of fruits and vegetables in the world with first rank in the production of Banana, Mango, Lime & Lemon, Papaya and Okra.
- The North Eastern region has two important advantages — climate and rainfall — over other places in the country. The untapped potential of North east can be utilized for exotic fruit and vegetable production.
-
Plantation Crops
- The term plantation crop refers to those crops which are cultivated on an extensive scale in contiguous area, owned and managed by an individual or a company. The crops include tea, coffee, rubber, cocoa, coconut, arecanut, oil palm, palmyrah and cashew
- Top Tea Producing States: Assam > West Bengal > Tamil Nadu.
- India is the second largest producer of tea.
- Top Coffee Producing States: Karnataka > Kerala > Tamil Nadu.
- The Department for Promotion of Industry and Internal Trade, under the Ministry of Commerce and Industry, has recently awarded this tag to — Coorg Arabica coffee from Karnataka, Wayanad Robusta coffee from Kerala, Chikmaglur Arabica from Karnataka, Araku Valley Arabica from Andhra Pradesh, and Bababudangiris Arabica coffee from Karnataka.
- Top Rubber Producing States: Kerala > Tamil Nadu > Karnataka.
- It is an equatorial crop, but under special conditions, it is also grown in tropical and sub-tropical areas.
Change in Cropping Pattern
Due to factors mentioned above the cropping pattern of India has changed after Independence and will change in future due to changing habits, climate and developing technologies.
At the beginning of the present century, nearly 83 percent of the total cultivable land of India was put under food crops and the remaining 17 percent was put under non-food crops. But in 1944-45, there was a change in the cropping pattern in India and area under food crops came down to 80 percent and the area under non-food crops slightly increased to 20 percent.
Among all the food crops, the largest increase in area since 1950- 51 has already been recorded by wheat cultivation which shows an increase of 132 percent by 1987-88. But in the case of both rice and pulses, the increase in area has been restricted to only 23 percent; Coarse cereals have recorded only marginal increase of 11 percent by 1987-88.
Phase I – Pre Green Revolution Phase
Phase II – Green Revolution Phase
Phase III- Globalization Phase
Phase IV – Horticulture awareness Phase
Pre-Green Revolution Phase – Ship to mouth Phase
- During this era, cropping pattern was poorly developed; mono cropping was widely being practiced that too with low level of production and productivity. Cereal like wheat and rice occupied major farms but their output and coverage was scattered and small.
- After the egregious neglect of agriculture by the Nehruvian focus on big industry, which was transmitted to the states, we hit the wall of foodgrain insufficiency in the 1960s
- Proportion of area under cultivation between food crops and non-food crops recorded was 74 : 26 in 1950-51
Green Revolution Phase
- With advent of high yielding varieties of crops, development of agriculture infrastructure and announcement of MSP by government encouraged farmers to switch for subsistence farming to intensive farming.
- Area under Rice and wheat increased owing to better productivity and assured purchase by government by means of MSP.
- Cereal anxiety led the Centre to offer minimum support prices (MSPs) for the major cereals, which distorted cropping patterns into the “cerealization” of agriculture, as it is called.
- Green Revolution also led to changes in the cropping patterns. Rice was introduced to Punjab, Haryana and Uttar Pradesh from traditional east and south India.
- Feature: Increase in area under rice and wheat, more than one crop a year, reduction in import.
Issues with rice and wheat Cropping System
- Ecological Issues
- Declining underground water table
- Ground water pollution: Excessive use of the fertilizers/insecticides pollutes the underground water quality
- Diverse weed flora
- Outbreak of disease and insect pest: The green crops with higher dose of N-fertilizers and wet conditions because of frequent irrigations are the paradise for the outbreak of insect-pest and diseases.
- Agricultural Issues
- Degrading soil structure
- Declining soil health
- Residue management: On farm residue management be the major issue in the prevailing cropping. Among rice and wheat straw residue, wheat residue is used in the animal husbandry sector but the higher silica content in rice straw make it inappropriate to be used in the dairy sector
- Labour shortage: Rice–wheat cropping system is water-, energy-, capital- and most importantly labour intensive as transplanting, spraying and harvesting of paddy require intense labour. Labour shortage is an emerging issue
- Multiple nutrient deficiencies
- Livelihood Issues
- Decreased land productivity
- High energy requirement: Intensive cultivation of the rice–wheat sequence leads to decline of underground water levels to a serious concern and as a result submersible pumps replacing the centrifugal pumps which lifts up water from the deeper depths but they required more energy for this purpose
- Decreased water productivity
- Decreased efficiency of water use
- Climatic Issues
- Environmental pollution: Management of the rice stubble is a major challenge. Smoldering is widely practiced by the farmers being easy and quick method of disposing off of rice residues thereby causing air pollution
- Global warming: Flaming of farm residues generates ample amount of greenhouse gases and aerosols and other hydrocarbons to the atmosphere affecting the atmospheric composition.
Conclusion
- MSP has distorted cropping patterns, with excessive focus on the cultivation of wheat, rice and sugarcane in the procurement states at the expense of other crops such as pulses, oilseed and coarse grains,” the NITI Ayog said in its Three Year Action Agenda.
- There is a need to move towards diversification from cerealization.
- With twin focus on Nutritional and Food security, government is now focusing on Horticulture too with schemes like Mission for Integrated development of horticulture (MIDH), Rashtriya Krishi Vikas Yojna (RKVY), Green House Subsidy, promoting processing sector and mega food parks.
- Price deficiency payment system will definitely encourage farmers to go for alternative crops instead of rice and wheat.
- The cropping pattern needs to be balanced keeping in view the rising population, Nutritional needs, food security, ecological balance and doubling farmers income.
Chapter 33: Irrigation System In India
Background:
- Irrigation is the controlled application of water through man-made systems to meet the water requirements of agriculture. Irrigation is an artificial application of water to crops or plants, especially when an agricultural field does not get enough water through rains.
- India is an agricultural country, and irrigation is critical to its agricultural growth. The country has a long history of irrigation dating back to ancient times, with the Indus Valley civilization being one of the earliest civilizations to use irrigation techniques.
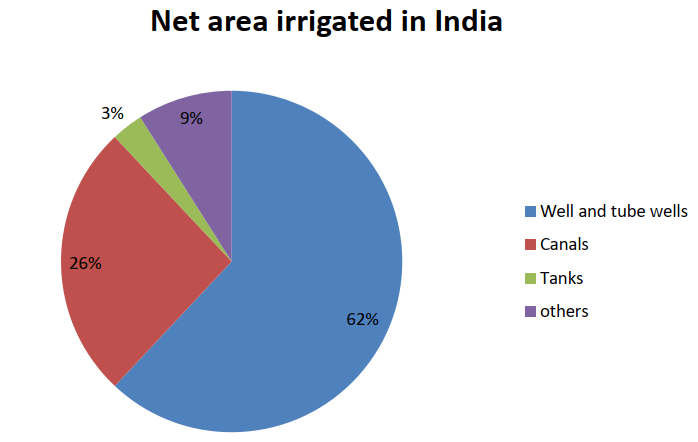
Different Types of Irrigation
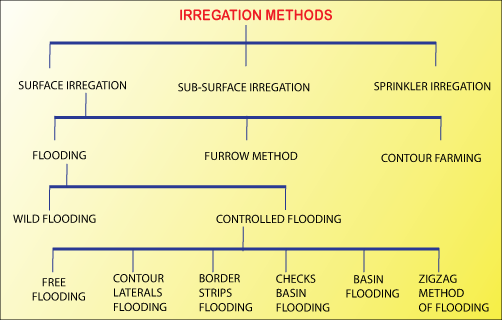
Well and Tube Well Irrigation
- Well and Tube Well irrigation is the most widely used irrigation system in India. The first tube well was dug in 1930 in Uttar Pradesh.
- There are currently over 50 lakh tube wells in operation across India. It has made a significant contribution to the success of India’s Green Revolution.
- Uttar Pradesh has the most area under well irrigation. It is followed by Rajasthan, Madhya Pradesh, Punjab, Gujarat, Maharashtra, and Bihar.
- Tube Well irrigation is the most widely used irrigation system in India.
- There are various types of wells, such as shallow wells, deep wells, tube wells, artesian wells, and so on.
- Water from shallow wells is not always available because the level of water drops during the dry months.
- Deep wells are better for irrigation because their water is available all year.
Canal Irrigation
- Canal irrigation is one of the most important sources of water. It accounts for about 24% of total irrigation in the country.
- It is an effective source of irrigation in low-level relief, deep fertile soil, and perennial river areas, which are mostly found in the northern plains.
- Inundation canals and perennial canals are the two types of canal systems.
- Canal irrigation refers to the method of transporting water by gravity from a river, reservoir, and tank via a canal to farmlands.
- The canals appear to have a trapezoidal shape and are made of reinforced concrete, brick masonry, and stone masonry.
- The canals are designed with adequate width and depth to carry enough water flow to the crop fields. Water will be distributed correctly for cultivation from the source point.
Tank Irrigation
- A tank serves as an irrigation storage system and is created by building a small bund of earth or stones across a stream.
- Rainwater can also be collected in these tank reservoirs and used for irrigation.
- Some tanks are constructed partially as dugouts and partially as enclosing bunds.
- Tanks vary in size, but the majority are small and built by individual farmers or groups of farmers.
- Tank irrigation is popular in the peninsular plateau region, which is led by Andhra Pradesh and Tamil Nadu.
- It is also a significant irrigation source in Karnataka, Madhya Pradesh, Maharashtra, Odisha, Kerala, the Bundelkhand region, Rajasthan, and Gujarat.
Micro Irrigation
- Micro-irrigation is a prudent irrigation technology that is being promoted both nationally and internationally in order to achieve higher cropping intensity and irrigation intensity through more focused water application to crops.
- Micro irrigation is defined as the application of a small volume of water at a low pressure and frequency.
- Micro-irrigation can boost yields while reducing water, fertiliser, and labour requirements.
- The system includes a large network of pipes that operate at low pressure.
- Drip irrigation, sprinkler irrigation, micro-sprinkler, porous pipe system, rain gun, are other systems of micro irrigation which are available, with drip irrigation and sprinkler irrigation being the most common.
Drip Irrigation
- Drip irrigation, also known as ‘trickle irrigation,’ is a method of applying the required amount of water directly to the root zones of plants at regular intervals via drippers or emitters.
- Drip irrigation is the most effective and can be used on a variety of crops, particularly vegetables, orchard crops, flowers, and plantation crops.
- Tree crops occupy the greatest percentage of the total area under drip irrigation in India, followed by vine crops, vegetables, field crops, flowers, and other crops.
- Water is applied near the plant root via emitters or drippers on or below the soil surface at a low rate ranging from 2 to 20 litres per hour in drip irrigation. With frequent irrigation, soil moisture is kept at an optimal level.
- Drip irrigation is the most efficient irrigation method and can be used on a wide range of crops, particularly vegetables, orchard crops, flowers, and plantation crops.
Sprinkler Irrigation
- In the sprinkler irrigation technique, water is sprinkled into the air and allowed to fall on the ground surface as if it were rain. The spray is created by forcing water through small orifices or nozzles.
- It is suitable for the majority of row, field, and tree crops. Water can be sprayed on top of or beneath the crop canopy.
- Sprinkler irrigation will not be appropriate if the site is known to be windy most of the time.
- Sprinklers are suitable for most soil types, but they work best in sandy soil. These are suitable for watering lawns, gardens, and agricultural fields.
- Except for paddy and jute, almost all crops in agriculture are suitable for sprinkler irrigation systems.
- Dry crops, vegetables, flowering crops, orchards, and plantation crops such as tea and coffee are all suitable and can be irrigated using sprinkler irrigation techniques.
Furrow Irrigation
- Furrow irrigation involves digging trenches or “furrows” between crop rows in a field.
- Farmers direct water down the furrows (often using only gravity), and it seeps vertically and horizontally to replenish the soil reservoir. The flow to each furrow is individually controlled.
- Furrow irrigation is ideal for broad-acre row crops like cotton, corn, and sugar cane. It is also used in the horticultural industries of citrus fruits and tomatoes.
- Furrow irrigation is one of the oldest irrigation methods because it is inexpensive and low-tech, making it particularly appealing in developing countries or areas where mechanised spray irrigation is unavailable or impractical.
- While furrow irrigation may not be the “hottest” new way to water crops, it is one of the most cost-effective and low-tech options for farmers, which is why millions continue to use it.
Surge Irrigation
- Surge irrigation is the intermittent application of water to improve the uniformity of distribution along a furrow.
- It operates on the premise that dry soil absorbs water faster than wet soil. When soil becomes wet, it seals due to the consolidation of soil particles at the surface.
- When water is reintroduced into a wet furrow, the wetting front moves quickly past the wetting zone and into dry soil. Dry soil slows progress at the wetting interface.
- This phenomenon enables faster advancement through the field with less deep percolation and improved application uniformity.
Sub Irrigation or Seepage Irrigation
- Watering from below the root zone, also known as seepage irrigation, is a method of delivering water to plants by controlling the level of the water.
- It is an effective method of water conservation with low labour requirements once the system is installed.
- Sub-irrigation in agricultural fields is accomplished by causing the water table to rise or fall.
- However, unlike flood or furrow irrigation systems, sub-irrigation does not flood the field up to the ground level.
- As a result, sub-irrigation is not commonly found in arid or semi-arid systems because sufficient moisture is required to germinate seeds at the surface level.
- In fact, areas that require high levels of drainage to be farmable are ideal candidates for a sub-irrigation system because the same network of drainage pipes and tiles that are installed to move excess water out of the ground can also be repurposed to add water when plant growth necessitates irrigation.
Problems Associated with Irrigation
- Expensive micro irrigation: Most adopters are wealthy farmers, and poor farmers cannot afford it.
- This problem is being addressed by various agencies by developing low-cost systems.
- International Development Enterprises (IDE), an NGO, is actively working in Maharashtra and Gujarat to innovate low-cost micro irrigation systems and raise awareness among poor farmers.
- Delay in project completion: The biggest issue in our major and medium irrigation sectors has been the tendency to start more and more new projects, resulting in a lack of project prolification since the First Five Year Plan.
- There is also a lag in utilising existing potential. Most projects have experienced delays in the construction of field channels and water courses, as well as land levelling and shaping.
- Inter-state Water Disputes: In India, irrigation is a state subject. Water resource development is thus planned by states individually, taking into account their own needs and requirements.
- All major rivers, however, have an interstate character. As a result, there are differences between states in terms of water storage, priorities, and use.
- Inter-state rivalries over water supply distribution are exacerbated by a narrow regional outlook.
- Regional disparities in irrigation development: According to the Ninth Five Year Plan Document, water resource development in the North Eastern region through major, medium, and minor schemes is only 28.6 percent, whereas it is 95.3 percent in the Northern region. This demonstrates a wide regional variation in irrigation facility development.
- Water logging and salinity: The introduction of irrigation has resulted in water logging and salinity in some states.
- Water logging affected approximately 2.46 million hectares in irrigated commands, according to a working group formed by the Ministry of Water Resources in 1991.
- The working group also estimated that salinity/alkalinity had affected 3.30 million hectares in irrigated commands.
- Increasing irrigation cost: From the first five-year plan to the tenth five-year plan, the cost of providing irrigation has risen.
- Water table decline: There has been a steady decline in water table in several parts of the country in recent years, particularly in the western dry region, due to over-exploitation of ground water and insufficient recharge from rainwater.
- Energy crisis in rural and urban India caused by power outages and unplanned interruptions: This problem can be solved by combining drip irrigation with a solar panel system, which is the best option for off-grid farmers.
Key reforms needed in irrigation in Indian agriculture:
- Improving infrastructure: There is a need to improve irrigation infrastructure, including canals, reservoirs, and pipelines, to ensure reliable and efficient water supply to farmers.
- Promoting efficient irrigation technologies: The adoption of efficient irrigation technologies, such as drip irrigation and sprinkler irrigation, can help in reducing water wastage and improving crop productivity.
- Encouraging farmers to adopt water-saving practices and natural farming: Farmers should be encouraged to adopt water-saving practices, such as crop rotation, intercropping, and mulching, to reduce water consumption and improve soil fertility.
- Enhancing institutional capacity: There is a need to strengthen the institutional capacity of water management institutions, such as the Water User Associations (WUAs), to ensure efficient and participatory water management practices.
- Promoting integrated water resources management: Integrated water resources management (IWRM) should be promoted to ensure sustainable and equitable use of water resources. IWRM includes a range of measures, such as watershed management, rainwater harvesting, and groundwater recharge.
- Strengthening legal and regulatory frameworks: The legal and regulatory frameworks related to water management should be strengthened to ensure effective water allocation, pricing, and regulation.
Environmental Effects of Irrigation
Waterlogging and Salinization
- On irrigated land, salinization is the leading cause of land loss for production and is one of the most common negative environmental effects of irrigation.
- Surface irrigation is frequently associated with waterlogging and soil salinization.
- Waterlogging is caused primarily by poor drainage and over-irrigation, and to a lesser extent by seepage from canals and ditches.
- Waterlogging concentrates salts drawn up from deeper in the soil profile in the rooting zone of plants.
Water-borne and Aquatic Diseases
- Irrigation is frequently associated with water-borne or water-related diseases.
- Malaria, whose vectors proliferate in irrigation waters, is one of the diseases most directly linked to irrigation.
- Other health risks associated with irrigation include increased agrochemical use, deterioration of water quality, and increased population pressure in the area.
Dam and Reservoir Environmental Impact
- Damming the river and creating a lake-like environment has a significant impact on the hydrology and limnology of the river system.
- The timing of flow, the quality, quantity, and use of water, aquatic biota, and sedimentation in the river basin all undergo dramatic changes.
- While there are direct environmental impacts associated with dam construction (for example, dust, erosion, borrow, and disposal issues), the greatest impacts result from water impoundment, flooding of land to form the reservoir, and alteration of water flow downstream.
Irrigation Schemes’ Socioeconomic Effects
- The most significant issue arising from large dam construction is the resettlement of people displaced by flooding of land and homes.
- This can be especially disruptive to communities, and insensitive project development would cause unnecessary problems due to inadequate compensation for the affected population.
- Human migration and displacement are correlated with a breakdown in community infrastructure, which causes social unrest and may contribute to malnutrition.
Conclusion
Agriculture is important to the Indian economy, and irrigation is a driving force behind agricultural development. Due to the uncertainty of rainfall in India, today’s reliance on irrigation has increased. Irrigation aids in the growth of agricultural crops, the preservation of landscapes, and the revegetation of disturbed soils in dry areas and during periods of below-average rainfall. Irrigation also serves other purposes in crop production, such as frost protection, weed suppression in grain fields, and soil consolidation prevention.
Chapter 34: Transporation and Marketting of Agricultural Products
What is Agricultural Marketing?
- Agricultural marketing is a method that includes gathering, storage, preparation, shipping, and delivery of different farming materials across the country.
- Agricultural marketing, which is essentially a subset of the overall marketing system, refers to all of the activities, agencies, and policies involved in farmers procuring farm inputs and moving agricultural produce from farms to consumers/manufacturers/exporters.
- An effective marketing system reduces costs while increasing benefits to all segments of society.
- It should provide remunerative prices to farmers, food of sufficient quality at reasonable prices to consumers, and adequate margins to middlemen to ensure their continued participation in the trade.
- Agricultural marketing has an essential function to play in the overall agricultural growth.
- It provides farmers with economic security through fair and remunerative compensation for agricultural produce.
- At the same time, it ensures affordable and accessible food products to consumers thereby reducing inflation.
- Agricultural marketing is a comprehensive system that involves a wide range of functions in the movement of agricultural commodities from producer to consumer.
- Various marketing functions are classified into three categories: exchange functions, physical functions, and facilitating functions.
Transport & Marketing of Agricultural Produce
- Agriculture is our most important industry, followed by transportation. These two industries rely on one another, and the national economy relies on both.
- A dependable and efficient transportation infrastructure has a significant influence on agricultural marketing.
- Agricultural products differ from industrial items in that they have unique features, making transportation quality as crucial as transportation availability.
- Agricultural items, for example, are large and perishable. The majority of them are consumable commodities.
- The packing and transportation must prevent the items from being bruised during travel.
Storage Of Agricultural Produce in India
- Storage of agricultural produce is the process of preserving harvested crops and livestock products for later consumption or sale. Proper storage helps to prevent spoilage, reduce post-harvest losses, and ensure food security.
- There are several methods of storing agricultural produce, and the choice of storage method depends on factors such as the type of produce, climate conditions, and storage period.
Forms of Storages of agricultural produce
- Warehouses: India has a network of public and private warehouses for storing agricultural produce. The Food Corporation of India (FCI) and the Central Warehousing Corporation (CWC) are two major government agencies that provide warehousing facilities across the country.
- Cold Storage: India has a large number of cold storage facilities for preserving perishable produce such as fruits, vegetables, and dairy products. The National Horticulture Board provides subsidies to encourage the construction of new cold storage facilities.
- Traditional Storage: In rural areas, traditional methods such as grain storage in mud houses, underground pits, or bamboo baskets are still used. These methods are low-cost and effective for storing grains and pulses.
- Grain Silos: Grain silos are used for storing grains such as wheat, rice, and corn. The government has set up the Food Corporation of India Silos Project to build modern silos with automated systems for monitoring and controlling storage conditions.
- Controlled Atmosphere Storage: This method involves storing produce in a controlled atmosphere with temperature, humidity, and oxygen levels carefully controlled. This method is commonly used for apples, pears, and other fruits.
- Food Parks:The government has set up food parks across the country to provide infrastructure facilities for food processing and storage. These parks have facilities for cold storage, warehousing, and food processing, and are designed to reduce post-harvest losses and improve the value chain of agricultural produce.
- Storage with cover: FCI, CWC, and SWCs all use this storage method the most. The grain storage method involves the use of a jute bag. Jute-bagged grains are stacked in god owns or warehouses.
- The Cover and Plinth (CAP) Method involves storing food grains openly with necessary safeguards like rat- and damp-proof plinths. Dunnage and covering stacks with special polythene covers, among other things, are also used in this method.
- Silos: Grain is stored in these tall tower-like structures. Silos are more efficient because they can operate around the clock and require 30% less land than traditional warehouses.
- Method of the silo bag: Silo-bags are a type of hermetic storage made from a plastic tube-shaped bag. The grains can be shielded from rain, UV rays, humidity, dust, etc., by these bags. Additionally, they are best suited for assisting with harvest logistics for short-term, high-volume grains.
What difficulties do food grain storage in India present?
- Lack of adequate storage facilities: At the farm level, India currently lacks the necessary storage facilities, resulting in grain pest and insect damage. Additionally, the country’s storage facilities are not suitable for the long-term storage of grains.
- India’s storage capacity imbalance: In 2013, a CAG report revealed a significant imbalance in storage capacity availability. It was discovered that storage facilities in consuming states lacked a significant amount of space. According to the report, 64% of the FCI’s total storage space was in large procurement states like Punjab, Haryana, Andhra Pradesh, Uttar Pradesh, and Chattisgarh.
- Infrastructure of subpar quality: The necessary conditions, such as the right temperature and moisture, are not present in the godowns or warehouses. This seriously deteriorates the grain quality, resulting in stock damage and waste. Because there are no secure storage facilities, the grains are infested with molds and insects. In light of this, the CAG report from 2013 noted that food grains in the central pools managed by State Government Agencies in Punjab and Haryana were severely damaged due to inadequate safe and scientific storage practices.
- Space-saving storage: During the procurement seasons, there were no adequate Cover and Plinth storage facilities, so stocks were simply deposited in open spaces without any safeguards to preserve these excessive grains. Because there isn’t enough plinth, water seeps from the ground and causes flooding and rain, causing damage to the stocks.
Constraints in Transport & Marketing of Agricultural Produce
- The main constraints in the transportation of agricultural produce in India are insufficient logistics connectivity, support, and facilities to ensure farmers’ timely delivery of their harvest into markets.
- Lack of services such as mobile cold storage for fresh perishable produce that cannot be stored at production centres but requires immediate transportation; and a lack of transport options that can cover longer distances in shorter times but are quite expensive and time-consuming.
- Concerning its marketing, there have been constraints related to direct marketing, assurance of better returns, taking into account the perishable nature of produce, reliance on the rural primary market viz. weekly haat and wholesale market called mandi.
- Poor market infrastructure, the presence of middleman culture, networks engaging in informal trading, and the absence of an institutional mechanism to engage with processors, wholesalers, aggregators, large retailers, and exporters.
Reforms needed in transportation of agricultural products in India include:
- Improving road infrastructure: India needs to invest in improving road infrastructure, including building new roads, repairing existing ones, and ensuring proper maintenance of roads. This will help reduce transportation time and costs, leading to improved profitability for farmers.
- Enhancing storage and packaging facilities: India needs to invest in enhancing storage and packaging facilities to reduce spoilage and maintain product quality during transportation.
- Implementing efficient logistics systems: India needs to implement efficient logistics systems that can help reduce transportation time, improve efficiency, and reduce transportation costs.
- Encouraging public-private partnerships: The government should encourage public-private partnerships to invest in transportation infrastructure, storage facilities, and logistics systems, to improve the efficiency and profitability of the sector.
- Streamlining government regulations: The government needs to streamline regulations related to transportation of agricultural products, including import/export restrictions, taxes, and tariffs, to reduce transportation costs and increase profitability.
- Providing financial support: The government needs to provide financial support to farmers and transporters to invest in transportation infrastructure, storage facilities, and logistics systems.
- Promoting alternative modes of transportation: India needs to promote alternative modes of transportation, such as water transport and railways, to reduce transportation costs and improve efficiency.
Steps Taken
- Launch of Kisan rails: Kisan rails are the first multi-commodity trains in the world. The quick delivery of perishable agricultural goods to markets like fruits and vegetables will be made easier with the help of these trains with chilled carriages. These will guarantee the transportation of agricultural goods across the nation.
- Krishi Udan scheme: Value realization (on agricultural goods) would significantly rise as a result, particularly in tribal territories and the north-east.
- Assistance with Transport and Marketing (TMA): It aims to assist with the international freight and agricultural product marketing aspects.
- This is likely to promote brand recognition for Indian agricultural products in the specified overseas markets and to mitigate the disadvantage of the higher cost of transportation of certain agricultural products due to trans-shipment.
- Kisan Rath mobile application: will permit the transportation of foodgrains and perishables.
Chapter 35: E-Technology in Aid of Farmers
Introduction:
E-technology stands for Electronic Technology. This includes the internet and related information technologies, and digital technologies, used of which have grown rapidly in recent years in all fields.
The impact of information and communication technology in agriculture can be evaluated broadly under two categories.
- First, Information technology is a tool for direct contribution to agricultural productivity.
- Secondly, as an indirect tool for empowering agriculturalists to make informed and quality decisions, it will have a positive impact on the agriculture and allied activities conducted.
Agricultural biotech and InfoTech together are helping to create new tools to-
- tackle the problem of consistent rural poverty.
- generate employment,
- increase farm productivity and production,
- improve quality and marketing.
Beneficial outcomes of e-Agriculture which enhance the quality of life of farmers include-
- bridging the information gap between the farmers and
- building a productive and competitive market,
- Different IT interventions support rural and under-developed markets to become efficient and pesticides.
- Farm animals are fed and monitored by electronic sensors and identification systems.
- Access to price information, access to agriculture information, access to national and international markets,
- Increasing production efficiency and so on.
Advantages of E-technology in aid of farmers
Some of the benefits derived by the farmers through ICT are given below:
- Improved decision making: By having the necessary information, farmers make improved decisions concerning their agricultural activities. The exchange of knowledge from various countries and organizations also helps farmers be more aware of factors to consider before making their decisions.
- Planning: IT has paved the way to come up with farming software that determines the best aids to use on the farm. Gaining information from their farm is essential in sustaining growth.
- Community participation: When a community adopts modern methods for agriculture, the production of local goods can be increased. With IT, there can be an improved union among local farmers, leading to better income for everyone involved.
- Agricultural innovations: When scientists develop new and improved techniques that help grow crops in adversities, a connected agricultural world will promote better reach.
- Better outreach: Not only small and medium farmers, but even backyard farmers also play a role in promoting agriculture. Use of e-technology will help in spreading ideas and innovations to all levels of farming sects.
Along with the advantages, e-agriculture has lots of problems like technical feasibility of connectivity in rural areas, cost involved in ensuring services, need for basic computer literacy, etc. Some of those problems are:-
- The reach of the technology is still very poor and a large number of farmers are still ignorant about such advancements.
- The distribution of technologies is not uniform throughout the country.
- The use of technology is being used by the already big-scale farmers is pushing the wealth gap wider. The small and marginal farmers are again being left out in the process of development.
- Due to the low literacy rate among farmers and the digital divide, there is a rise of a new class of middlemen, who provide ICT services to farmers.
- The rural infrastructure for the use of ICT is also not uniform and a lot of regional disparity persists.
How digital technologies can help farmers?
- Crop monitoring: Digital tools such as remote sensing and drones can help farmers monitor their crops for pests, diseases, and nutrient deficiencies. For example, the Indian start-up AgroScout has developed an AI-powered app that uses image recognition to detect crop diseases in real-time.
- Weather forecasting: Digital tools such as mobile apps and SMS-based services can provide farmers with accurate weather forecasts, allowing them to plan their farming activities accordingly. For example, the Indian Meteorological Department provides farmers with weather updates through its Kisan SMS service.
- Market access: Digital platforms such as e-commerce websites and mobile apps are helping farmers reach new markets and get better prices for their produce. For example, the Indian e-commerce platform AgriBazaar connects farmers directly with buyers, eliminating intermediaries and reducing transaction costs.
- Financial services: Digital platforms such as mobile banking and digital wallets are helping farmers access financial services such as loans and insurance. For example, the Indian start-up PayAgri has developed a mobile app that provides farmers with access to credit and insurance products.
- Precision agriculture: Digital tools such as precision farming sensors and GPS-enabled tractors are helping farmers optimize their use of resources such as water and fertilizer. For example, the Indian start-up FarmAgain has developed a low-cost precision farming solution that uses sensors to monitor soil moisture and temperature.
- Training and extension services: Digital tools such as online courses and mobile apps are helping farmers access training and extension services to improve their farming practices. For example, the Indian start-up AgroStar provides farmers with access to expert advice and product recommendations through its mobile app.
Examples of Digital initiative for agriculture in India
- Kisan Call Centre: The Ministry of Agriculture and Farmers Welfare launched this program in 2004 to take advantage of the potential of ICT in agriculture. The primary objective of the project is to respond to phone calls from farmers in their native tongue.
- Village Resource Centers: Space-based services are provided by Village Resource Centers in rural areas. They are one of the few initiatives that uses satellite data from Earth Observation (EO) and the Satellite Communication (SATCOM) network to reach out to villages and meet the needs of the people there.
- Digital Agriculture Mission: Projects based on emerging technologies like artificial intelligence (AI), blockchain, remote sensing and geographic information systems (GIS), and the use of robots and drones will be supported and accelerated by the Digital Agriculture Mission, which will run from 2021 to 2025.
- AgriStack: The Ministry of Agriculture and Farmers Welfare plans to create a collection of technology-based agricultural interventions called “AgriStack.” It will establish a single platform through which farmers can receive services from beginning to end throughout the agriculture food value chain.
- National Agriculture Market: also known as e-NAM, is an online platform in India for trading agricultural commodities. Through the market, commodities can be traded online between farmers, traders, and buyers.
Issues With Farmers in Accessing Digital Technologies in India
While digital technologies offer numerous benefits to farmers in India, there are also several challenges that prevent farmers from accessing and using these technologies effectively.
Some of the key issues with farmers accessing digital technologies in India:
- Lack of digital literacy: Many farmers in India have limited digital literacy and may not be familiar with how to use digital technologies effectively. This can be a major barrier to accessing and using digital platforms and services.
- Poor internet connectivity: Internet connectivity is often poor in rural areas of India, where many farmers live and work. This can make it difficult for farmers to access digital platforms and services, particularly those that require high-speed internet connections.
- Cost: The cost of digital devices and services can be prohibitive for many farmers, particularly those who are small-scale or have limited resources. This can prevent farmers from investing in digital technologies that could help them improve their farming practices.
- Language barriers: Many digital platforms and services are only available in English or other languages that may not be familiar to farmers. This can make it difficult for farmers to access and use these services effectively.
- Lack of technical support: Farmers may not have access to the technical support they need to troubleshoot issues with digital devices or platforms. This can make it difficult for them to adopt digital technologies effectively.
Overall, digital technologies are helping Indian farmers improve their productivity, reduce costs, and access new markets and financial services. These technologies are playing a crucial role in transforming Indian agriculture and improving the livelihoods of farmers.
Conclusion
The Indian agriculture sector has still not been able to overcome the digital divide that is prevalent for so many years in rural development scenarios. Hence, it is high time to fill the digital gap for farmers.
It is important to adopt a holistic approach to address the challenges faced by Indian agriculture to achieve inclusive growth and sustainable development.
Chapter 36: Issues Related to Direct And Indirect Farm Subsidies
What are farm subsidies?
The government’s proactive measure to help farmers in the agricultural industry produce more and receive the necessary compensation is called farm subsidies. It influences the pricing and supply of agricultural goods and aids in managing their supply.
Let’s first examine the need for such subsidies before examining what direct and indirect subsidies are and the problems they raise.
It balances inter-regional imbalances, encourages agricultural production, and aids in the promotion of agricultural development. Additionally, it is anticipated that subsidies will advance agricultural mechanization, encourage better crop patterns, provide employment prospects, etc.
The following are examples of agricultural subsidies:
- Direct farm subsidies: An immediate sponsorship is a sort of endowment that is being given to the rancher by the public authority in type of money while the roundabout appropriation is being given by means of limits on other farming buys like yields and manures. The Farm Loan Waiver Scheme, PM Kisan Scheme, and other similar programs are the most typical examples of direct subsidies.
- Indirect farm subsidies: Subsidies in which the price of the product is set lower than the market price are known as indirect subsidies. Indirect subsidies account for roughly 2% of India’s GDP. Examples: Subsidies for irrigation, electricity, fertilizer, credit, and the minimum support price (MSP) are just a few examples.
- Explicit Input Subsidy: This type of subsidy is provided to farmers for the purchase of agricultural goods like fertilizers and crops. Small and marginal farmers who are unable to independently purchase crops and fertilizers receive this kind of subsidy.
- Subsidy for Implicit Input: This kind of subsidy doesn’t give farmers money, but it does cut costs for them. like reducing interest rates on bank loans and providing subsidies for electric bills.
- Output subsidy: This kind of subsidy lets the government’s strict trade policies give farmers a good price for their crops and stops traders from charging arbitrary prices.
Subsidies Given to Indian Farmers by the Government of India:
- Subsidy for fertilizer: Under the government’s fertilizer subsidy, traders could buy fertilizers from manufacturers and sell them to farmers at a discount. The trader receives payment from the government for the difference. Through the fertilizer subsidy, the government guarantees farmers affordable access to high-quality fertilizers. While also ensures that both the trader and the manufacturer receive a fair return. The finance ministry of the Government of India (GOI) has allocated a fund of Rs. 63,222,32 crores for the subsidy for urea.
- Seed Support: The government of India offers farmers a subsidy for purchasing seeds, and the amount of this subsidy varies depending on the crop. For cottonseed, the government offers a subsidy of Rs 15 per kilogram, or 25% of the total order value. The available subsidy for certified seed distribution is Rs. 20/Kg.
- Subsidy for Power: In states like Gujarat, where it costs Rs 8 per unit of electricity consumed for residents but only 60 paise per unit for farmers, Indian farmers receive a subsidy on electricity. Farmers can get free electricity in states like Andhra Pradesh, Karnataka, Punjab, and Telangana.
- Credit Assistance: The government offers farmers credit subsidies in a variety of ways, including waiving loan interest, paying off bad debts, and providing low-interest loans through regional rural banks (RRBs).
- Subsidy for irrigation: Because farmers need to spread a network of drips across their agricultural land, irrigation costs a lot of money. The approximate cost of laying drip pipe per acre is Rs 45,000-60,000. As a result, the GOI offers farmers discounts on irrigation equipment like pumps and drip pipes.
- Water assistance: The government’s goal with the water subsidy is to supply every farmer with clean pumped water. As a result, the Government of India is building new dams and canals to make it easier to manage water.
What advantages do farm subsidies provide?
- Encourage Farm Income: Farm subsidies raise farmers’ purchasing power and, as a result, their standard of living.
- Food supplies: The farm subsidies guarantee a sufficient supply of food and lessen the likelihood of food shortages and inflation.
- Overcome the Income Gap: 70% of rural Indian households, according to FAO, primarily rely on agriculture for their livelihood. The income gap is closed by providing income support to marginal and small farmers. It ensures that poor farmers are supported during times of loss and encourages farmers to take risks.
- Encourage Economic Expansion: Farm output is enhanced by subsidies, such as those used to construct irrigation systems. Increased demand (consumer) contributes to economic expansion when farm incomes rise. Additionally, it increases employment opportunities.
- Reach National Objectives: In order to achieve objectives like the Sustainable Development Goals (SDG) and the US$ 5 trillion economy status, farm subsidies are crucial levers.
What worries do farmers have about farm subsidies?
- Financial Stress: Around 2% of India’s GDP is made up of farm subsidies. About 21% of farmers’ total income comes from subsidies. The government’s finances are overburdened by a large number of farm subsidies, leaving less room for capital expenditures.
- Waste of resources: It leads to overuse and waste of resources, such as when subsidized farm electricity is used for personal gain.
- Deterioration of the Environment: Urea and DAP have been used excessively as a result of fertilizer subsidies. Fertlizers overuse pollute the soil and water, which is bad for the environment.
- Accumulate Disparities: The majority of farm subsidies, according to critics, are monopolized by large, wealthy farmers, they argue. Subsidies don’t serve a purpose like this.
- Pattern of Distorted Cropping: The MSP and other farm subsidies have distorted crop patterns, such as the predominance of wheat and paddy in Punjab and Haryana at the expense of pulses, maize, vegetables, and so on.
- Leaks and Corruption: Corruption and leaks can occur with farm subsidies. As a result, welfare benefits are cut and costs rise. Urea intended for farms is diverted for use in factories or smuggled into neighboring nations.
- Concerns Regarding the WTO: At the World Trade Organization, developed nations question India’s farm subsidies. MSP violates the WTO-restricted Aggregate Measures of Support (AMS) level because it is regarded as a trade distortion.
WTO’s Agreement on Agriculture (AOA)
The objective of AOA is to facilitate open market access and global market integration while also removing trade barriers. The agreement is based on three main tenets.
- Domestic Assistance: solicits the elimination of domestic subsidies that stifle free trade and fair price. This stipulates that developed nations’ aggregate measure of support (AMS) will decrease by 20% over six years, while developing nations’ AMS will decrease by 13% over ten years.
- Market entry: In order to facilitate free trade and convert non-tariff barriers into tariff duties, it ensures that individual nations set tariffs.
- Export Assistance: The Kelker committee recommended converting export subsidies into capital investments in order for all nations to phase out export subsidies in accordance with the Nairobi package of WTO Measures.
Classification of farm subsidies by WTO
Green, Amber, and Blue box subsidies contain subsidies.
- Green box subsidies are those that should not include price support and do not sway trade. There are no restrictions on these. Ex: PM Kisan was created by the government for farmers.
- All government policies deemed to stifle trade and production are referred to as “amber box” Subsidies that are directly linked to the quantity of production. Ex: MSP.
- Blue box subsidies are meant to lessen distortion and are referred to as “amber box subsidies with conditions.”
Reforms needed.
- Rationalizing subsidies by terminating those that are not producing the desired outcomes.
- Long-term export trade policies are needed to keep farmers aligned with exports and ensure continuity. Actively promoting financial inclusion in rural areas.
- Constructing warehouses and cold chain facilities close to the farm gate.
- Holistically developing the agricultural sector by strengthening links both backwards and forwards.
- A sunset clause ought to be included in subsidies.
- Promoting initiatives to make agriculture profitable, such as cooperative farming and contract farming.
- The farm bill is a good idea that should be strictly implemented to give farmers more power and break the APMC market monopoly.
- Both food and nutritional security should receive equal attention from the government.
- Developing a price and demand forecasting system for the purpose of providing farmers with better price realization and crop selection assistance
Conclusion
India is an agricultural country, employing more than 70% of the population. Furthermore, this industry makes a substantial contribution to the Indian economy. As a result, the agricultural sector’s progress is vital for both Indian inhabitants and the Indian economy. Subsidies are often regarded as the most effective tool for accelerating agricultural output growth among agricultural production incentives. The majority of the subsidies granted are intended to compensate for the high cost of production and to encourage the adoption of new inputs. Subsidies are critical for the advancement of farmers in India.
Chapter 37: Public Distribution System
The Public Distribution System (PDS)
The Public Distribution System (PDS) evolved as a system for the distribution of food grains at affordable prices and the management of emergencies. Over the years, the term PDS has become synonymous with the term ‘food security’ and is also an important part of the Government’s policy for the management of the food economy in the country.
Till 1992, PDS was a general entitlement scheme for all consumers without any specific target. But in 1992, PDS became RPDS (Revamped PDS) focusing the poor families, especially in the far-flung, hilly, remote, and inaccessible areas. In 1997 RPDS became TPDS (Targeted PDS) which established Fair Price Shops for the distribution of food grains at subsidized rates.
The objectives of the PDS are:
- To provide essential food items at affordable prices to vulnerable sections of the population.
- To stabilize prices of essential commodities in the market.
- To prevent hoarding and black marketing of food grains.
- To reduce hunger and malnutrition among economically disadvantaged communities.
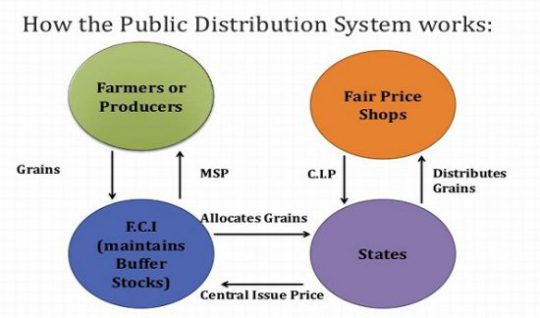
Evolution of PDS system
The Public Distribution System (PDS) in India has a long history, dating back to the 1940s. Here is a brief overview of the key milestones in the history of the PDS system in India:
- 1940s:During the Second World War, the British Government introduced a rationing system in India to ensure that food supplies were distributed equitably among the population.
- 1950s:After India’s independence, the government introduced a universal PDS system, which provided food grains to all households at subsidized rates.
- 1960s:In the 1960s, the government introduced the Green Revolution, which led to a significant increase in food grain production in the country. The PDS system was expanded to distribute these additional food grains to the population.
- 1970s:In the 1970s, the government introduced targeted PDS programs, which focused on providing food grains to vulnerable sections of the society, such as the poor, pregnant women, and children.
- 1990s:In the 1990s, the government introduced reforms to the PDS system, including the introduction of a food coupon system and the use of electronic cards to distribute food grains.
- 2000s: In the 2000s, the government launched the Antyodaya Anna Yojana program, which provided subsidized food grains to the poorest of the poor.
Significance of TPDS
In the People’s Union for Civil Liberties v. Union of India case, the Supreme Court contended that the “right to food” is essential to the right to life as provided in Article 21 of the Constitution.
In line with this Parliament passed the National Food Security Act (NFSA) in 2013. The NFSA seeks to make the right to food a legal entitlement by providing subsidized food grains to almost two-thirds of the population.
It relies on the existing Targeted Public Distribution System (TPDS) mechanism to deliver these entitlements.
Salient features of the Act
- Coverage and entitlement under Targeted Public Distribution System (TPDS): Up to 75% of the rural population and 50% of the urban population will be covered under TPDS, with uniform entitlement of 5 kg per person per month. However, since Antyodaya AnnaYojana (AAY) households constitute poorest of the poor and are presently entitled to 35 kg per household per month, entitlement of existing AAY households will be protected at 35 kg per household per month.
- State-wise coverage: Corresponding to the all-India coverage of 75% and 50% in the rural and urban areas respectively, State-wise coverage will be determined by the Central Government. State-wise coverage has been determined by the Planning Commission on the basis of 2011-12 NSSO Household Consumption Expenditure Survey data.
- Subsidized prices under TPDS and their revision: Foodgrains under TPDS will be made available at subsidized prices of Rs. 3/2/1 per kg for rice, wheat and coarse grains for a period of three years from the date of commencement of the Act. Thereafter prices will be suitably linked to Minimum Support Price (MSP).
- Identification of Households: Within the coverage under TPDS determined for each State, the work of identification of eligible households is to be done by States/UTs.
- Maternity Benefit: Pregnant women and lactating mothers will also be entitled receive maternity benefit of not less than Rs. 6,000 as per scheme to be formulated by the Central government.
- Women Empowerment: Eldest woman of the household of age 18 years or above will be the head of the household for the purpose of issuing of ration cards.
- Grievance Redressal Mechanism: Grievance redressal mechanism at the District and State levels. States will have the flexibility to use the existing machinery or set up separate mechanism.
- Transparency and Accountability: Provisions have been made for disclosure of records relating to PDS, social audits and setting up of Vigilance Committees in order to ensure transparency and accountability.
- Food Security Allowance: Provision for food security allowance to entitled beneficiaries in case of non-supply of entitled foodgrains or meals.
How the PDS system works in India?
- Procurement of food grains: The government procures food grains, such as rice and wheat, from farmers through various agencies, such as the Food Corporation of India.
- Allocation of food grains: The government allocates food grains to the states based on their population, and the states distribute them to the districts.
- Identification of beneficiaries: Eligible households are identified through various criteria, such as the Below Poverty Line (BPL) and Antyodaya Anna Yojana (AAY) categories. These households are issued ration cards, which entitle them to purchase subsidized food grains from fair price shops (FPS).
- Distribution of food grains: Fair price shops are run by the government or private individuals and are located across the country. Eligible households can purchase food grains at a price lower than the market rate from these shops. The food grains are distributed through a network of FPS, which are supervised by state governments.
- Monitoring and evaluation: The government monitors and evaluates the PDS system to ensure that food grains are distributed efficiently and effectively. This includes measures such as electronic point of sale (ePOS) machines to track sales, social audits, and grievance redressal mechanisms.
Problems With Implementation
Inefficiencies in identifying beneficiaries:
- Exclusion and inclusion of Below Poverty Line (BPL) and Above Poverty Line (APL) families from beneficiary data results in significant errors. The lack of reliable regular data exacerbates the targeting issue; there are no regular official estimates of households’ actual income.
- Beneficiaries who are entitled do not receive food grains, while those who are not eligible receive excessive benefits. The Ministry of Rural Development’s expert group on the BPL census methodology discovered that while 25% of non-poor households were included on the BPL list, approximately 61% of eligible people were left off the list.
- Ghost cards are another sign that beneficiaries have been incorrectly classified in several states. Cards with people’s names on them are called “ghost cards.” Ghost cards suggest that grain is sold on the open market instead of going to well-off households.
Reforms needed in PDS System:
- The complete computerization of the PDS: There are two reasons why the Justice Wadhwa Committee Report for PDS (2011) recommended computerization: a first one to stop theft and a second one to make it possible for safe identification at ration stores.
- PDS to all kinds: Every household in Tamil Nadu has access to subsidized food grains as a result of the state’s universal PDS. Errors in exclusion can be reduced in this way.
- Digitalization: To streamline TPDS, states like Chhattisgarh and Madhya Pradesh have used information technology to digitize ration cards, use GPS delivery tracking, and use SMS-based citizen monitoring.
- Adhaar card Use: States and UTs have been asked to seed the Aadhaar Number wherever it is available as part of Beneficiary Data Digitization in order to eliminate bogus, duplicate, and ineligible beneficiaries. The Aadhaar number has been linked to the data of 61.25% of beneficiaries so far.
- Transfers of cash directly: The Government is also working with States and UTs to select Direct Benefit Transfer (DBT) as a means of preventing leakage and diversions. Under this option, beneficiaries will have their subsidy component credited to their bank accounts, allowing them to purchase foodgrains from any market.
- Increasing the storage capacity: Since it is recognized that storage capacities must be enhanced to guarantee the proper storage of purchased food grains for PDS programs. As a result, the country’s storage capacities have increased through private investment in Public Private Partnership (PPP) models and the use of funds from plan schemes. Godowns are built by private investors and hired by FCI for a guaranteed ten years under the Private Entrepreneur Guarantee (PEG) Scheme.
- Combating corruption in the system: The establishment of a vigilance committee at the state, district, block, and fair price shop (FPS) levels is a requirement of every State/UT government. Every scheme covered by the National Food Security Act is regularly monitored by these committees, and any violations or misappropriation of funds are reported in writing to the District Grievance Redressal Officer.
In accordance with the new policy for allocating Fair Price Shop licenses, Panchayats, Self-Help Groups, and Cooperatives receive preference.
Tips for making PDS work better:
Experts like Abhijeet Banerjee, Amartya Sen, and Raghuram Rajan have publicly recommended that everyone in need receive a temporary ration card for a period of six months with minimal checks in order to include the excluded from the PDS during this pandemic.
They have made a valid observation: The social cost of letting in some who might be able to do without it is far greater than the cost of missing many people who are in desperate need.
- Door-to-Door Delivery: This kind of temporary e-coupon system has been implemented by the Delhi government. At the ration collection points during this pandemic, every respondent complained of overcrowding. Due to the total absence of social distance standards, they also expressed concern about contracting the disease. Door-to-Door Delivery is a good option for dealing with this kind of situation.
- The government may consider expanding and diversifying distribution points in the event that the introduction of doorstep delivery takes some time. PDS delivery points have already been used by government schools, but in an emergency, other public spaces like sports stadiums, public parks, and post offices can be used to distribute food.
- To provide sufficient food: As an immediate solution, the Kerala government’s establishment of community kitchens that provide free food should be considered by various state governments. In the current situation, Kerala’s community kitchens have achieved significant success.
- Addressing the issue of food quality: Technology-driven solutions have the potential to address both short-term and long-term issues. In order to end the threat of adulteration and low-quality food grains, new technologies like the Internet of Things, Artificial Intelligence, and Machine Learning could be used immediately.
- Keeping everyone accountable: In a petition filed by Delhi Rozi Roti Adhikar Abhiyan, which sought time-bound redress for complaints regarding non-supply of rations and transparency in the distribution of food grains, the Delhi High Court suggested one mechanism for checking and making the process of distribution more accountable.
- A separate unit to inspect rations: Experts recommend that a distinct group of government workers be established specifically for this purpose and stationed at each FPS. They could be referred to as ration inspectors, and their responsibility would be to guarantee the FPS’s impartial and trouble-free delivery of food grains. The Ministry of Consumer Affairs, Food, and Public Distribution only needs to be notified of the formation of such a cadre before the legislation can be implemented.
Conclusion
The Public Distribution System is a critical resource for the food security of the poor, especially the urban poor and women who manage household food supplies. Increasing the food supply to the poor is a major challenge for the government. As many people died due to starvation in the past, the Public Distribution System has played an important role in helping the needy. In the Indian sense, India’s Public Distribution System is the world’s largest distribution network of its kind.
Chapter 38: Issues of Buffer Stocks
Introduction:
Buffer stock is a reserve that is used to offset price fluctuations and unanticipated emergencies. Most of the time, buffer stock is kept for things like food grains, pulses, and other necessities.
The first-time food grains were stockpiled in India was during the 4th Five Year Plan in 1969. The Food Corporation of India was established in 1964 under the Food Corporation Act to carry out the Food Policy’s goals.
Objectives of having a buffer stock
- Price stabilization: By ensuring that there is always a minimum amount of stock on the market, buffer stock contributes to the stabilization of a commodity’s price. The buffer stock can be used to raise the price of a commodity when there is a limited supply, or it can be used to lower the price when there is a large supply.
- Stabilization of supply: By ensuring that a certain quantity of a commodity is always on hand in the market, buffer stock also contributes to the stabilization of the supply. This may assist in preventing commodity shortages or surpluses, which can result in price swings and economic instability.
- Stabilization of income: By ensuring that farmers and other producers receive a stable price for their goods, buffer stock can also help to stabilize their income. This may assist in lessening the impact of market fluctuations on their means of subsistence.
- Food safety: By ensuring that there is always a minimum amount of stock available in the market, buffer stock can also be used to ensure food security. Especially during times of crisis or emergency, this can help to ensure that people have access to food and prevent food shortages.
- Grains used in welfare programs: The government’s social welfare programs, like the Targeted Public Distribution System (TPDS) and Other Welfare Schemes (OWS), like providing food to people who have been displaced by natural disasters and the midday meal program for school-age children, are made possible by the purchase of food stocks.
Buffer Norms
The minimal amount of food grains that the central government must keep on hand at the start of every quarter to ensure adequate supplies for the public distribution system and other government distribution programmer.
Food Stock held by the following entities is accessible in the central government’s pool: State Government Agencies (SGAs) States participating in the Decentralized Procurement Scheme
Throughout the year, food grains from the Central Pool are dispersed based on patterns in off-take and procurement. As a result, a key component in determining the minimum food grain reserves needed in any given quarter of the year is the season of production and procurement.
Problems with buffer stocks
- The high cost of administration and logistics: Because the majority of the funds are allocated for the purchase of buffer stocks, the Agricultural Ministry and FCI have difficulty adjusting the budget to make money available for the effective creation and operation of storage units. These instances demonstrate how this is feasible:
- Double Waste: In India, a significant portion of the population is dying from hunger, and inadequate storage practices are also contributing to the depletion of enormous food stocks. After the purchase, warehousing issues include a lack of storage space and other infrastructure.
- Wastage: Rats, frost, and rain frequently spoil food grains in open, outdoor storage, costing the government a lot of money.
- Issues with transportation: It costs a lot to transport grains to and from the FCI godowns. During shipping, spills and deterioration also contribute to an increase in losses.
- Abuse and robbery: Ghost recipients, alcoholic beverage manufacturing facilities, and illicit markets may occasionally receive the buffer stockpiles. A significant portion of the population suffers from hunger as a result, while others benefit from buffer stocks of food grains in place of the target population.
- The practice of unfair trade practices: The government’s purchase of food grains and maintenance of buffer stocks are seen as trade-distorting by many Western industrialized nations. In the same vein, they summon India to the WTO.
- Affects cropping pattern: For staple grains like rice and wheat, combining buffer stocks with MSP results in a skewed pattern of crop output. Because these crops need a lot of water to grow, more fertilizer is needed to make them more productive. By affecting crop diversity and the environment, this puts India’s nutritional security at risk. Farmers who live in areas where growing rice and wheat is difficult will also be more likely to grow those crops.
- Open-End Purchasing: In the absence of a precise estimate of the total buffer stock required to run the PDS and in emergency situations, the open-ended procurement of food stocks further complicates the proper storage and consumption of buffer stocks.
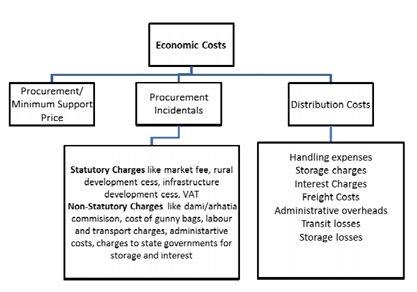
Food Security
Definition: The condition of having physical, social, and financial access to sufficient, safe, and nutritious food that meets dietary requirements and preferences for an active and healthy life is known as food security. To put it another way, food security means that everyone has access to enough food at all times to live an active and healthy life.
Food security is a fundamental human right and a crucial component of human well-being. Not only is it important for people’s health and well-being, but it also helps communities and nations grow economically and socially. Hunger, malnutrition, poverty, and social unrest can all result from a lack of food security.
Food security is made up of four main parts:
- Availability: The quantity of food produced, imported, or donated is what is meant by the term “availability of food.”
- Access:The ability of individuals to obtain food, either by producing it themselves or by purchasing it from markets or other sources, is referred to as access to food.
- Utilization: The capacity of an individual to absorb and utilize food’s nutrients to prevent malnutrition and maintain good health is referred to as “utilization of food.”
- Stability:Food stability is the long-term availability and accessibility of food, which is necessary to guarantee food security.
Importance of food security in India
- Malnutrition and hunger: To ensure that everyone has access to sufficient, safe, and nutritious food to meet their dietary requirements, food security is essential. A significant number of children in India are malnourished, and approximately 14% of the population is malnourished. Food security can help solve these problems and make people’s health and well-being better.
- lowering poverty: Food insecurity can help reduce poverty because of the close relationship between the two issues. Food security can help ensure that vulnerable populations have access to enough food to meet their basic needs and act as a safety net.
- Economic expansion: Economic expansion and development also depend on food security. Social unrest and instability can result from a lack of food security, which can impede economic expansion. Food security can contribute to stability, which is necessary for economic development and growth.
- Agricultural progress: Since agriculture is the primary source of food production, there is a strong connection between agricultural development and food security. Food security can encourage agricultural development, which in turn can support economic growth and reduce poverty.
- Securing the country: Because food is a fundamental requirement for a population’s survival, food security is also crucial to national security. Food security can aid in the prevention of social unrest and instability, both of which can be detrimental to national security.
Relationship Between Food Security and Buffer Stocks
- Food security and buffer stocks are closely linked. The quantity of food grains that the government purchases and stores in order to maintain price stability and guarantee food security is referred to as buffer stocks. Because it helps to ensure that there is an adequate supply of food to meet the needs of the population, especially during times of shortage or crisis, the upkeep of buffer stocks is an important tool for ensuring food security.
- Food security is dependent on buffer stocks’ ability to maintain food price stability. It can be hard for people, especially those who are poor or vulnerable, to get food when prices are high or unstable. Food prices can be stabilized and food remains affordable and accessible to all by maintaining buffer stocks.
- In times of natural disaster, drought, or other emergency, buffer stocks can also help to ensure that there is an adequate supply of food. During these times, food supply can be disturbed, prompting food deficiencies and food frailty. During these times, buffer stocks can be put on the market to make sure that the population has enough food to eat.
Challenges To Food Security
- Population – Despite the fact that a significant portion of the Indian population is engaged in agricultural activities, the availability of food for all is a challenge as a result of the country’s growing population.
- Poverty– This is one of the most significant obstacles that must be overcome in order for the nation to achieve the desired level of food security. Extremely high is the percentage of people living below the poverty line (BPL).
- Climate change: has had a significant impact on farming and agricultural activities in recent years. There are floodplains and droughts in some areas.
- Corruption– Diverting the grains to open market to get better margin, selling poor quality grains at ration shops, and the irregular opening of the shops adds to the problem of food insecurity.
- Inadequate storage facilities– Inadequate and improper storage facilities for grains, which are frequently stored outside under tarps that provide little protection from humidity and pests.
- Lack of Awareness– Lack of education and training The production of food grains, for example, is slowed down by traditional farming practices, which take slightly more time.
- Unmonitored nutrition programs: Implementing well-monitored nutrition programs must be prioritized.
Shanta Kumar High Level Committee
The Central government set-up a high-level committee to study the core issues of FCI and make suitable recommendations to restructure FCI to improve its operational efficiency and financial management. As per this only 6% Indian farmers could sell their produce to Government agencies and 45% of PDS food grain is black marketed
Key Recommendations of Shanta Kumar Committee
- Transfer of Responsibility (Decentralisation): FCI should transfer all procurement operations at least to states who have considerable experience and infrastructure. These are Andhra Pradesh, Chhattisgarh, Haryana, Madhya Pradesh, Odisha and Punjab. FCI should instead procure only the surplus which is contributed to the Central pool by these states to support farmers in distress due to small landholdings and thus have to settle with a sale price far below the MSP in states like UP, Bihar, West Bengal, Assam. In addition, it should channelize this surplus for various subsidy acts like NFSA.
- Rational Procurement: There should be uniformity and rationality in procurement operations
- The Centre will not accept any additional/surplus food-grains from states who give subsidy/bonus to farmers above the MSP. Such states will have to bear all costs (storage and distribution) themselves.
- Uniform statutory levies among all states around 3 or 4% of MSP.
- Stringent quality checks at the when accepting food grains for Central pool.
- NWRS: Encourage and speeding the Negotiable Warehouse Receipt System (NWRS) under which farmers can park their produce in registered warehouses and even get up to 80% advance from banks at MSP. This will considerably reduce the storage costs and responsibility of the government.
- Diversify the Pool: Prioritise pulses and oilseeds and their MSP should be taken seriously and implemented uniformly across the country. MSP has been largely operational in wheat and rice and that too only in some select states, while the other important food-grains have suffered in their backdrop. Also, Government should streamline trade policy and MSP.
- Digitalisation: NFSA should be revised with no subsidy to be offered to states which don’t have computerised the list of beneficiaries (which can be verified) and have not set up vigilance committees to check pilferage. This has been done to plug leakages in the PDS whose range in some states has gone upto 70%. Complete end-to-end computerisation of the food management system in India.
Thus, though the recommendations may seem to plug-in many loopholes but such massive restructuring will not bear much fruit as the main issue of food pricing and storage are not done by suo moto decisions of FCI. Also, with NFSA in place it is highly unlikely that government can roll-back subsidies for the time-being. MSP has brought in obligations for better storage facilities. The underlying question is thus, how far these recommendations will be adopted, in face of stiff reluctance from some states.
- Limits under NFSA: The coverage of NFSA should be brought down from 67% population to 40%. This will comfortably cover the BPL population and even some above that. Also, the targeted beneficiaries must be given 6 months ration in advance, right after the procurement season draws to a close. This will bring down storage overheads borne by government and procurement agencies.
- Outsourcing: FCI should outsource its food-grain stocking operations to agencies like CWC, SWC, private warehouses etc.
- DBT: Direct Cash Transfers to farmers to help them raise productivity and overall food production in the country. This will empower them and reduce their dependence on money-lenders. Another landmark recommendation is the introduction of cash transfers in PDS in cities with a population of over 1 million. These can be done via Aadhaar numbers of Pradhan Mantri Jan DhanYojana.
- Efficiency of FCI: must be increased by rationalising its overall structure like giving VRS to higher officials, outing permanent labours and hiring contractual labours.
- Easing the burden: The panel had recommended liquidation of government’s grain stocks via OMSS or in export markets, whenever stocks go beyond the buffer norm.
Can Private firms be given responsibility?
The entire grain management system is fully controlled by the government that edges out private players. Allowing private players in buffer stock management could bring the market forces in the system that in turn could increase the overall efficiency of the system. Continuously rising food security bill and need for improving the efficiency in the system calls for a review of the buffer stock management policy to involve private traders in procurement whilst the government retains total control on the whole stock management process. The government can set buffer stock targets keeping 3-5 years’ timeframe in sight and some select stockists can be licensed by them to participate in buffer stock management with quantity allocation.
Food Security Programs in India
- Public Distribution System
The public distribution system is one tool for ensuring home food security. Through a regulatory system, the primary objective of PDS is to ensure that families receive necessary consumer goods in an equitable manner at socially acceptable prices.
- National Food Security Mission
During the Eleventh Plan, the project was started in 2007-2008 with the goal of producing 10 million tonnes more rice, 8 million tonnes more wheat, and 2 million tonnes more pulses. Through land expansion, increased productivity, job opportunities, and initiatives to help farmers regain confidence, the scheme aims to increase output. Currently, this program is being implemented in 17 states across the nation.
- Rashtriya Krishi Vikas Yojana (RKVY)
The Rashtriya Krishi Vikas Yojana (RKVY) was launched in 2007-2008 under the Eleventh Plan and was funded by Rs. 25,000 crores to meet the goal of achieving a 4% growth rate in agricultural and related industries by increasing public investment in states. As part of this initiative, several technology packages for increasing agricultural production have been distributed in Assam, Bihar, Chhattisgarh, Jharkhand, Orissa, Eastern Uttar Pradesh, and West Bengal.
- The Integrated Scheme of Oilseeds, Pulses, Oil Palm, and Maize (ISOPOM)
This scheme for the production of oilseeds was implemented on April 1, 2010 in 14 major states; 15 for oil palm and 10 for maize. NFSM and the pulses component were combined. A useful instrument for crop diversification will be this plan. The scheme aims to assist in the acquisition of breeder seeds, the production of founder seeds, certified seed production and distribution, and plant protection incentives like chemicals, equipment, and weedicides.
- Poshan Abhiyan
The Hon’ble Prime Minister officially launched Poshan Abhiyan on March 8, 2018, in the Jhunjhunu district of Rajasthan. Abhiyaan focuses on the nutritional status of adolescents, pregnant women, breastfeeding mothers, and children aged 0 to 6 years old. Through the use of technology, convergence, and community involvement, the program aims to reduce the rate of stunning, under-nutrition, anemia, and low birth weight in children. It also places an emphasis on adolescent girls, pregnant women, and lactating mothers, addressing malnutrition holistically.
Chapter 39: Economics of Animal Rearing
What Is Animal Rearing?
- Animal rearing refers to the process of raising animals for various purposes, including food, fiber, and labor. It involves the care and management of animals to ensure their health and well-being, as well as their productivity.
- Animal rearing can include a wide range of animals, including livestock such as cows, pigs, sheep, goats, and poultry, as well as other animals such as horses, donkeys, and camels.
- Animal rearing practices can vary depending on the type of animal being raised and the purpose for which it is being raised.
For example, dairy cows may be kept in barns and milked regularly, while chickens may be raised in coops and allowed to roam freely. The animals may be fed a variety of diets, including grass, hay, grains, and supplements.
- Animal rearing can be an important source of income and livelihood for many people, particularly in rural areas. It can also provide important food and other products for human consumption.
- However, animal rearing can also have environmental impacts, particularly if it involves intensive production methods or if waste is not properly managed. As such, it is important to ensure that animal rearing practices are sustainable and environmentally responsible.
Benefits of animal rearing to Farmers:
- Alternative Income to farmers: Animals serves as moving bank and assets which provide economic security to farmers and helps them to earn quick money during emergencies. Livestock live cow, sheep helps farmers to get subsidiary income by selling milk and other animal products.
- Food and Nutrition: Bovine animals and poultry ensure a constant supply of milk and eggs which helps to get the required nutrition to farmers and their families.
- Social Security: Animals offers a sense of social security in rural areas, especially landless farmers who own more livestock are better placed than others.
- Draft power of animals: Bullocks are the backbone of Indian agriculture. Despite a lot of technological advancements, Indian farmers are still dependent on bullocks for various agricultural operations.
- Animal waste such as dung can be used as a fertilizer and reducing the dependence on market-based fertilizers. It also helps farmers to move towards Zero Budget Natural Farming.
- Resilience to climate change: As livestock is less prone to global warming and climate change, it can be considered more reliable than rain-fed agriculture.
Animal Rearing and Inclusive Growth:
- Provides Self-employment to millions of people especially in rural areas and can also contain forced migration.
- Risk mitigation by providing a sense of security and confidence to landless, small, and marginal farmers.
- The distribution of livestock is more equitable than that of land. Ex: Government of India providing cows to Rwanda part of Girnika program.
- Animal husbandry promotes gender equality by empowering women economically and socially.
- It is observed that the incidence of rural poverty is less in states like Punjab and Haryana where livestock accounts for a sizeable share of agri-income.
- Combats Malnutrition and hidden hunger in the children, providing opportunities for all in economic development.
Challenges/Issues involved.
- Outbreak of Diseases: Frequent outbreaks of Foot and Mouth disease, Black Quarter infection, Brucellosis, etc, which affect livestock and productivity.
- Yield and productivity issues: Although India is the largest producer of milk, the yield of Indian cattle is only about 50% of the global average.
- Contributor to Greenhouse gases: Across the world, the livestock sector contributes to 14.5% of human-induced greenhouse gas emissions, whereas in India livestock sector contributes to 58% of agricultural emissions (as per 2012 estimates).
- Lack of technology advancements: Limited artificial inseminations, deficiency in quality germplasm, lack of technical manpower.
- Funding issues: The livestock sector received only 12% of total expenditure on agriculture and allied sector. Which is very less as per its size and contribution to GDP.
- Poor insurance coverage: Only 6% of animal heads are provided with insurance coverage.
- Market access: markets for livestock and its products are underdeveloped and are not formalized acting as a disincentive to farmers to adopt livestock.
- Presence of informal sector: About half of the meat production comes from the unregistered slaughterhouses which are leading to poor price realization to farmers.
- Lack of quality checking and standardization of animal products leading to poor quality exports and returning of exports by other countries under sanitary products.
Measures and Suggestions
- Ensuring feed and fodder security by enhanced fodder seed production; using high yield fodder varieties; development of fodder banks; and improvement of wastelands, other community lands for fodder.
- Niti Aayog @75 recommendations:
- Breeding indigenous cattle with exotic breeds to enhance productivity.
- Promoting and developing Bull mother farms with an objective to produce good quality genetically superior bulls and also to promote cross-breeding.
- Establishing village-level procurement systems for better supply chain management.
- Capacity building for farmers and fish breeders with new technology penetration.
- Institutional strengthening to provide better credit and insurance coverage to the livestock farmers.
- Boosting infrastructure by establishing cold chains and storage facilities as livestock products are perishable in nature.
- Public spending needs to be increased to re-energize the livestock sector.
- Veterinary services should be strengthened and ensure vaccination of animals to prevent the occurrence of diseases in livestock.
- Promoting research and development to enhance the productivity of animals.
- India should strictly follow the sanitary and phytosanitary standards as laid down by Codex Alimentarius Commission which is formed by FAO and WHO.
Steps Taken by Government:
- Establishment of Dairy Processing and Infrastructural Development Fund to enable the milk processing capacity in the country.
- Animal Husbandry Infrastructure Development Fund (AHIDF) is proposed with 15,000crores to leverage private investment and ensure availability of capital to the farmers and also to provide direct or indirect livelihood creation.
- National Animal Disease Control Programme (NADCP): The program aims to control the livestock diseases the foot and mouth disease and brucellosis in livestock by 2025 and eradicate these by 2030.
- Budget 2020-21 proposed to establish.
- KISAN RAIL and KISAN UDAN to provide connectivity.
- Artificial insemination to be increased to 70% from the current 30%.
- MGNREGA to include the development of fodder farms.
- Schemes like Rashtriya Gokul’s mission for the improvement of indigenous breeds and to sustain the extreme climatic conditions.
- E Pashu Haat Portal to connect the breeders and farmers regarding the quality bovine germplasm.
Components of Animal Rearing
Fisheries- Blue Revolution:
- Potential:
-
- India is the 2nd largest producer of fish.
-
- Employs around 16 million fish farmers and even more at a higher value chain.
-
- Contribution to GDP around 1% of GDP in 2017-18.
- In order to realize the full potential government has launched the Blue revolution with a clear-cut objective:
-
- Modernize the fisheries sector with new technologies.
-
- Generate employment and promotion of exports.
-
- Promotion of Inclusive growth by empowering farmers.
-
- Increasing food production in a sustainable manner.
- Challenges faced by the fisheries sector:
-
- Shortage of quality and healthy fish seeds.
-
- Lack of mapping of zones of fishes and poor fishing vehicles.
-
- Absence of standardization and branding of fishes.
-
- Inadequate extension staff and lack of training to fishers and nonavailability of skilled man force.
-
- Usage of obsolete technology, depletion of inland natural waters are challenges in inland fisheries cultivation.
-
- Usage of unsustainable practices like blast fishing.
-
- Lack of strong value chain which makes India poor performing state in exports even though we are 2nd largest producer.
- Measures to boost the Blue revolution:
-
- Promoting community participation in fishermen by establishing FPO’s in the fisheries sector.
-
- Development of post-harvest infrastructure by developing cold storage infrastructure, processing plants, etc.
-
- Restoration of natural productivity and conservation of indigenous fishery resources.
-
- Promotion of integrated farming system- rice cum fish agriculture on the lines of Kuttunad below sea level farming.
-
- Upgradation of fishing vessels and using satellite technology of Gagan and Gemini to map fishes rich zones.
- Government Schemes:
-
- Integrated development and management of the fisheries sector for focussed development and management of the fisheries sector.
-
- Pradhan Mantri Matsya Sampada Yojana adopts a cluster-based to strengthen backward and forward linkages.
Dairy Sector- White Revolution:
- Potential & Advantages:
-
- India also has the largest bovine population in the world.
-
- In India, milk production is growing by 6.4% during the last 5 years and has increased from 146.3 million tonnes(mt) in 2014-15 to 187.7 mt in 2018-19.
-
- As per the National Sample Survey Office’s (NSSO) 70th round survey, 23% of agricultural households with very small parcels of land (less than 0.01 hectare) reported livestock as their principal source of income.
-
- Egalitarian and inclusive, as most of the livestock is concentrated in dryland areas and with small and marginal farmers, the development of animal husbandry is considered to be more.
- Understanding the potential of the dairy sector government has launched Operation Flood with the following objectives:
-
- To promote cooperative societies to enhance procurement, storage, transportation of milk.
-
- Production of a wide variety of milk products and their marketing management.
-
- Provide superior breeds of cattle, health services, veterinary treatment, and artificial insemination facilities.
-
- The achievements of operation flood/white revolution.
-
-
- Alternative occupation to rural masses.
-
-
-
- Became leading producer in milk
-
-
-
- Quality of livestock and promotion of indigenous livestock.
-
-
-
- Small and Marginal farmers along with landless laborers are benefitted.
-
- Challenges in the Dairy Sector:
-
- Inadequate market facilities and informal sector, as per economic survey 2018-19 about 36% of the milk sold is handled by the organized sector and the rest by the unorganized sector.
-
- In most places, cattle are kept under unhygienic conditions.
-
- Incidence of diseases such as Foot and Mouth diseases.
-
- Climate change led to an increase in temperature affecting productivity.
-
- Poor coverage of livestock insurance.
-
- Infrastructural deficiencies such as cold chain facilities leading to milk losses.
- Measures towards New white revolution/Operation Flood 2.0:
-
- Geotagging of animals helps us to keep track of health-related issues of a particular animal.
-
- Strengthening the Dairy Development Extension Program and creating a network of strong value chains.
-
- Using technology like Artificial Intelligence and Machine learning to run simulations on how to increase the productivity of the animals.
-
- Following the Niti Aayog’s recommendations as cited above.
- Government Initiatives:
-
- National Livestock Mission focuses on the development of livestock and adequate availability of quality feed and fodder.
-
- Gobar-Dhan(Galvanizing Organic Bio-Agro Resource Dhan) will manage and convert cattle dung and solid waste in farms to compost, biogas, and bio-CNG.
-
- Rashtriya Gokul Mission to develop indigenous breeds in a scientific manner.
-
- Dairy Entrepreneurship Development Scheme under NABARD for generating self-employment opportunities in the dairy sector, covering activities such as enhancement of milk production.
-
- Doubling of milk processing capacity to 108 million MT from the present 53.5 million MT by 2025(budget 2020-21)
Conclusion:
In a country like India where greater than 50% of the population is involved with agriculture and Agri-based activities, it is the need that the farmers diversify their risks by managing parallelly the livestock which helps not only in generating extra money but also to ensure nutritional security in the families of farmers. Hence government investing in the livestock sector will ensure to bring inclusive development and also enhances the export potential and ultimately fulfilling the dream of doubling the farmer’s income by 2022.
Chapter 40: Food Processing Industries In India
Introduction:
- The food processing industry involves the conversion of raw food ingredients into a variety of food products through various processes such as cleaning, sorting, grading, cooking, preservation, packaging, and distribution.
- The primary goal of food processing is to improve the safety, quality, and shelf life of food products, as well as to add value to the raw materials used in their production.
- The food processing industry is a crucial component of the global food supply chain, and it plays an essential role in meeting the demand for safe and nutritious food products worldwide.
- It is also a major contributor to the economy, providing employment opportunities and generating revenue through exports.
- The industry is highly regulated to ensure food safety, and it operates under strict quality standards to meet the expectations of consumers.
- With a market value of approximately $600 billion in 2020, India’s food processing sector is one of the largest in the world. From 2021 to 2026, the industry is expected to expand at a CAGR of 10.7%, driven by factors like growing urbanization, rising disposable incomes, and shifting lifestyles.
Facts about the Indian Food Processing Industry (FPI)
- India’s food processing industry is one of the largest in the world, and its output is expected to reach $535 billion by 2025 and 2026. India’s food processing industry is a crucial link between farmers and consumers in domestic and international markets.
- The Ministry of Food Processing Industries (MoFPI) is doing everything in its power to promote investment all the way up the value chain. India’s food processing industry focuses primarily on dairy products, beverages, sugar, edible oils, grains, and grains.
- 41 Mega Food Parks, 348 Cold Chain projects, 68 Agro-Processing Clusters, Creation of 61 Backward and Forward Linkages Projects, and 6 Operation Green projects have been approved by PMKSY nationwide.

Scope of FPI in India
- Despite China being the world’s largest producer of fruits and vegetables, only about 2% of India’s produce is processed.
- With 50% of the world’s buffaloes and 20% of the world’s cattle, India has the largest livestock population, but only about 1% of the world’s meat production is converted to value-added products. Unorganized businesses make up more than 75% of the sector.
- The level of processing is low (less than 10 percent), despite the large production base. Processing accounts for 35% of milk, 6% of poultry, 2% of fruits and vegetables, and 8% of marine products.
- This industry faces a significant obstacle in the form of a dearth of sufficient varieties that can be processed.
- India’s agricultural exports currently primarily consist of raw materials that are processed in other nations, providing yet another opportunity to move up the value chain.
Importance Of the Indian Food Processing Industry
- Employment: One of India’s largest employers, the food processing industry employs millions of people, particularly in rural areas.
- Agriculture: Agriculture, a major source of income in India, is closely linked to the food processing industry. The industry contributes to farmers’ income by assisting in the value addition of agricultural produce.
- Exports: With a variety of processed food products being exported to nations all over the world, India’s food processing industry is a significant contributor to the country’s export earnings.
- Food safety: By reducing losses after harvest and increasing the availability of food products, food processing contributes to food security, particularly in regions with low agricultural productivity.
- Nutrition: By increasing the availability of fortified food products, particularly for vulnerable populations like children and pregnant women, the food processing industry can help improve the nutritional status of the population.
- Construction of infrastructure: Infrastructure, such as cold storage facilities, warehouses, and transportation networks, have emerged as a result of the food processing industry’s expansion, which has benefited other sectors as well.
Factors affecting location of FPI
The location of food processing industries in India is influenced by a range of factors, including:
- Proximity to raw materials: The availability of raw materials is a key factor in determining the location of food processing industries. Industries tend to locate near agricultural regions, where raw materials such as fruits, vegetables, grains, and spices are produced.
- Transportation: Transportation costs play a significant role in determining the location of food processing industries. Industries tend to locate near transportation hubs, such as ports, highways, and railways, to minimize transportation costs.
- Infrastructure: The availability of infrastructure, such as cold storage facilities, warehouses, and processing facilities, is an important factor in determining the location of food processing industries.
- Labor availability: The availability of skilled and unskilled labor is an important factor in determining the location of food processing industries. Industries tend to locate in areas with a large pool of skilled labor, particularly in specialized areas such as food science and engineering.
- Market demand: The location of food processing industries is influenced by market demand. Industries tend to locate near their target markets, such as urban areas or areas with high tourist traffic.
- Government policies: Government policies, such as tax incentives, subsidies, and regulations, can influence the location of food processing industries. Governments may offer incentives to encourage industries to locate in specific regions, or may regulate the location of industries to protect public health and safety.
Upstream and Downstream requirements of food processing industries
Upstream stage: The upstream stage of the production process involves searching for and extracting raw materials. The upstream part of the production process does not do anything with the material itself, such as processing the material. This part of the process simply finds and extracts the raw material. Thus, any industry that relies on the extraction of raw materials commonly has an upstream stage in its production process.
Downstream stage: The downstream stage in the production process involves processing the materials collected during the upstream stage into a finished product. The downstream stage further includes the actual sale of that product to other businesses, governments or private individuals. The downstream process has direct contact with customers through the finished product.
Upstream requirements:
- Accessibility to raw materials.
- Modern extraction techniques.
- Good linkages with farmers.
- Storage facilities for raw materials like Grains, Meat, Fish etc.
- Quality testing facilities.
- Transport facilities.
Downstream requirements:
- Latest processing techniques.
- Latest processing machinery.
- Quality testing facilities.
- Organized retail stores for faster distribution.
What is Supply Chain Management?
- Supply chain management (SCM) is the planning, coordination, and management of all the activities involved in the production, transportation, and delivery of goods and services from the source of raw materials to the point of consumption.
- It involves the management of the entire network of businesses and individuals that are involved in the production and delivery of a particular product or service.
- SCM includes various activities such as procurement, inventory management, transportation, warehousing, and distribution. It also involves managing relationships with suppliers and customers, as well as the flow of information and finances throughout the supply chain.
- The primary goal of SCM is to optimize the supply chain in terms of cost, quality, and delivery time, while minimizing risks and disruptions. This involves balancing the competing demands of customers, suppliers, and other stakeholders in the supply chain, and ensuring that the right products are delivered to the right place at the right time.
Significance of SCM in Food Processing
Supply chain management is critical to the success of the food processing industry for several reasons:
Quality and safety: The food processing industry is highly regulated, and strict quality and safety standards must be maintained throughout the supply chain to ensure that food products are safe for human consumption. Effective supply chain management can help ensure that these standards are met by identifying potential risks and implementing measures to mitigate them.
Efficiency: The food processing industry is characterized by tight margins and intense competition. Efficient supply chain management can help reduce costs and increase profitability by optimizing processes, reducing waste, and improving inventory management.
Traceability: In the event of a food safety issue, the ability to trace a product back to its source is critical to containing the problem and minimizing its impact. Effective supply chain management can help ensure that products can be traced throughout the supply chain, from the source of raw materials to the point of consumption.
Sustainability: Consumers are increasingly concerned about the environmental impact of the food they eat, and the food processing industry is under pressure to reduce its carbon footprint and minimize waste. Supply chain management can help promote sustainability by optimizing transportation, reducing packaging waste, and sourcing materials from sustainable suppliers.
Innovation: The food processing industry is constantly evolving, and supply chain management plays a critical role in driving innovation. By collaborating with suppliers, manufacturers, and other stakeholders in the supply chain, food processing companies can identify new opportunities and develop new products and processes that meet the changing needs of consumers.
Obstacles to Food Processing Industry
Blockages on the supply and demand sides: Lack of raw material availability is caused by fragmented holdings, low farm productivity as a result of lack of mechanization, high seasonality, perishability, and inadequate intermediation (supply chain). Food processing and exports are hampered as a result.
Issues with the infrastructure: Lack of cold chain infrastructure causes more than 30% of farm-gate produce to be lost. Lack of all-weather roads and connectivity causes erratic supply.
Gaps in the law: Food safety and packaging are governed by a number of laws, each enacted by a different ministry or department. Due to the proliferation of legislation and administrative delays, food safety specifications and guidelines are inconsistent.
Concerns about the quality of food have been raised by the widespread use of fertilizers, pesticides, and other chemicals. These concerns require investigation. Also necessary is protection from unfair and dangerous practices like adulteration. Unless fortified, processed foods may lack nutritional balance and pose a health risk, particularly for children. This could cause people to have a bad impression of processed foods, which could hurt the profits the industry makes.
A lack of control over safety and quality: Implementing quality and safety standards is difficult due to the large number of unorganized players in the food value chain, particularly. As a result, practices like using carbide to ripen fruit and adulterating milk have become more common.
Consumer ignorance: A crucial factor in the country’s improved nutritional situation is consumer awareness. There are currently a number of nutritional, food safety, and quality issues that consumers are unaware of.

Reforms needed:
Infrastructure development: The food processing industry in India suffers from inadequate infrastructure, including poor storage facilities, inefficient transportation networks, and inadequate power supply. Reforms are needed to address these issues and develop modern, efficient infrastructure that can support the growth of the sector.
Simplification of regulations: The food processing industry in India is subject to a complex web of regulations that can be difficult to navigate. Simplification of regulations and a move towards a more streamlined, transparent regulatory framework would help reduce the compliance burden on businesses and promote investment in the sector.
Access to finance: Access to finance is a major challenge for many food processing companies in India, particularly small and medium-sized enterprises. Reforms are needed to increase access to affordable finance, including measures to promote financial inclusion and support the development of innovative financing mechanisms.
Skill development: The food processing sector in India requires a skilled workforce with expertise in areas such as food safety, quality control, and supply chain management. Reforms are needed to support the development of vocational training programs and promote skill development in these areas.
Research and development: Innovation is key to the growth of the food processing sector in India. Reforms are needed to support research and development, including measures to promote collaboration between industry and academia, and incentives to encourage the development of new products and processes.
Major Government Initiatives
Food Processing Sector Vision 2015: for Food Processing the Ministry of Food Processing Industries (FPI) has provided funding for a study to create a strategy for the sector’s expansion. India’s share of global food trade is to be increased from 1.5% to 3% by 2015, according to the adopted Vision 2015, which calls for increasing perishable processing from 6% to 20%, increasing value addition from 20% to 35%.
National Mission on Food Processing (NMFP)
On April 1, 2012, the Ministry of Food Processing Industries (MOFPI) introduced the National Mission on Food Processing (NMFP), a brand-new Centrally Sponsored Scheme (CSS) that will be implemented through States and UTs.
Pradhan Mantri Kisan SAMPADA Yojana: The Ministry of Food Processing Industries (MoFPI) launched the Pradhan Mantri Kisan SAMPADA Yojana, a central government program.The PM Kisan Sampada Yojana is a complete package that will lead to the creation of cutting-edge infrastructure and effective supply chain management from the farm gate to the retail outlet.
Mega Food Park Scheme: The “Cluster” approach underpins the Mega Food Park Scheme, which envisions the establishment of cutting-edge support infrastructure in a clearly defined agri-horticultural zone for modern food processing units in the industrial plots of the park with a well-established supply chain.
Operation Green: The purpose of the price-fixing scheme known as Operation Greens is to guarantee that farmers receive the appropriate price for their produce. It aims to promote professional agri-produce management, processing facilities, Farmer Producer Organizations (FPO), and agri-logistics. It connects farmers and consumers, focusing on organized marketing of tomatoes, onions, and potatoes (TOP vegetables
Conclusion:
To sum it up, the food processing industry in India has tremendous potential for growth, and the sector’s vision for the next decade should be to increase its contribution to the GDP and reduce food wastage. The industry, farm sector, premier technical institutions, and the government should work together to achieve this vision by adopting modern technologies, developing new products, and improving infrastructure and supply chain efficiency.